IAI America PCON-PO User Manual
Page 71
59
4. Operation Using I/O Signals
4.3.4
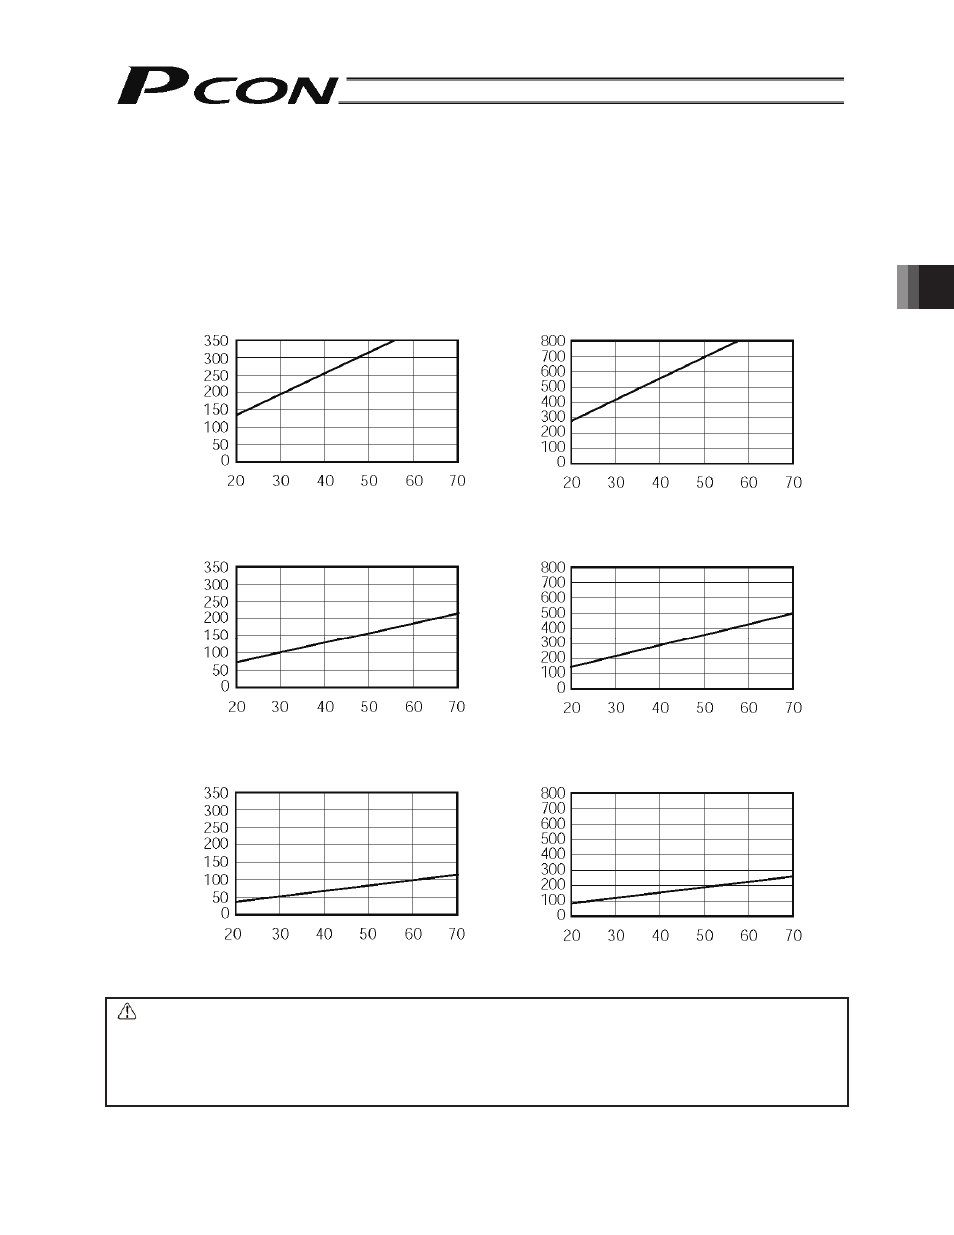
Correlation Diagram of Current-limiting Value and Push Force for Each Actuator
The correlation diagram of current-limiting value [%] and push force [N] is shown below for each actuator.
z Slider Type
(1) SA5C/SA6C/SS7C type
(2) SA7C type
Caution:
Accuracy of push force while the actuator is standing still is not guaranteed. The above figures
should be used for reference purposes only.
Take note that if the push force is too small, the actuator may malfunction during push-motion
operation due to slide resistance, etc.
The maximum current-limiting values are as shown in the graphs above. The minimum
current-limiting values should be at least 20%.
Low-speed type
(lead: 3 mm)
Low-speed type
(lead: 4 mm)
Push force (N)
Push force (N)
Push force (N)
Push force (N)
Push force (N)
Push force (N)
Medium-speed type
(lead: 6 mm)
Medium-speed type
(lead: 8 mm)
High-speed type
(lead: 12 mm)
High-speed type
(lead: 16 mm)
Current-limiting value (%)
Current-limiting value (%)
Current-limiting value (%)
Current-limiting value (%)
Current-limiting value (%)
Current-limiting value (%)