Survey results example, 362 survey results example – Apple iWork '09 User Manual
Page 362
Survey Results Example
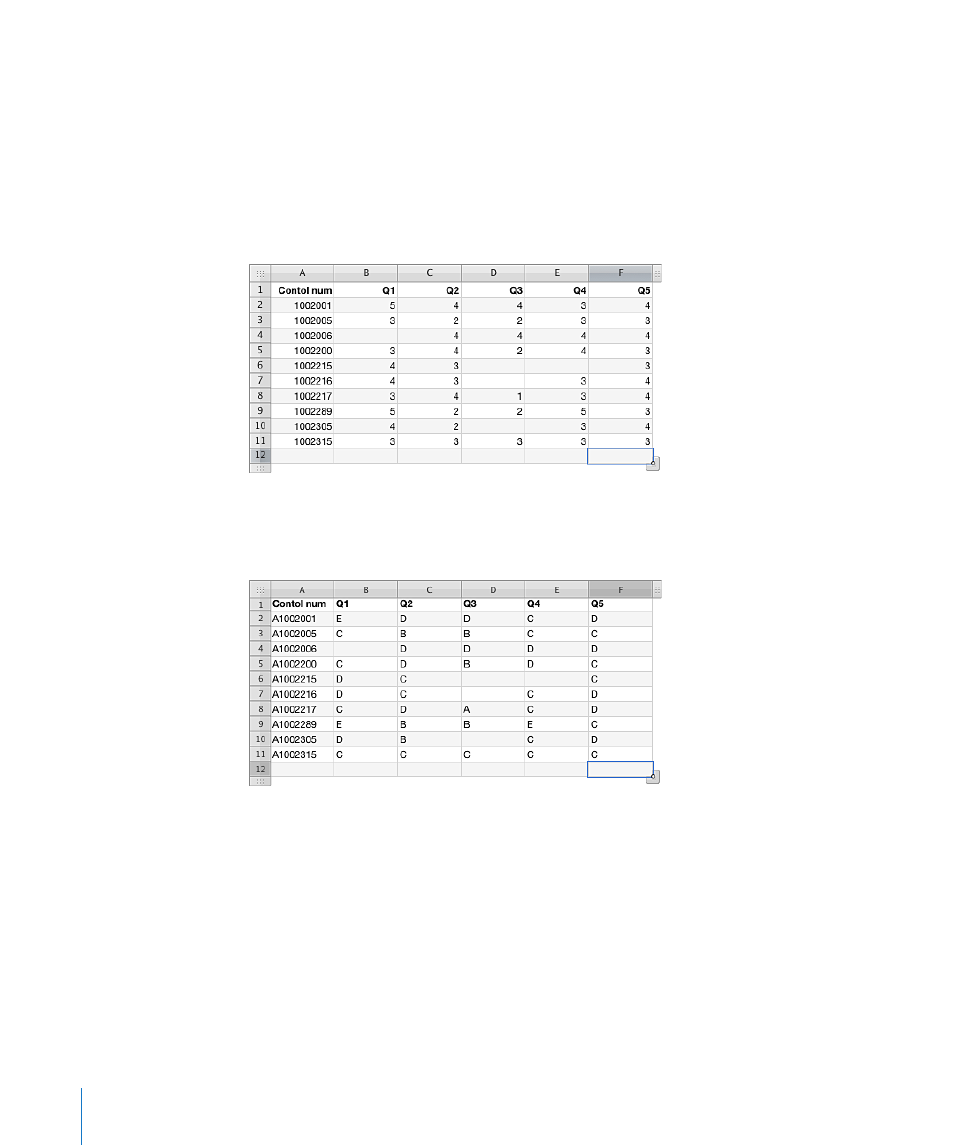
This example brings together the illustrations used throughout the statistical
functions. It is based on a hypothetical survey. The survey was short (only five
questions) and had a very limited number of respondents (10). Each question could
be answered on a scale of 1 to 5 (perhaps the range from “never” to “always”), or not
answered. Each survey was assigned a number before mailing. The following table
shows the results. Questions that were answered outside the range (incorrect) or not
answered are indicated with a blank cell in the table.
To illustrate some of the functions, assume that the survey control number included an
alphabetic prefix and that the scale was A–E, instead of 1–5. The table would then look
like this:
Using this table of data and some of the statistical functions available in iWork, you
can gather information about the survey results. Keep in mind that the example is
purposely small so results may seem obvious. However, if you had 50, 100, or more
respondents and perhaps many more questions, the results would not be obvious.
362
Chapter 13
Additional Examples and Topics