Apple iWork '09 User Manual
Page 266
If additional statistics are not returned (stats is FALSE), the array returned is one row
deep. The number of columns is equal to the the number of sets of known-x-values
plus 1. It contains the line slopes (one value for each row/column of x values) in
reverse order (the first value relates to the last row/column of x values) and then the
value for b, the intercept.
If additional statistics are returned (stats is TRUE), the array contains five rows. See
“Additional Statistics” on page 267 for the contents of the array.
Examples
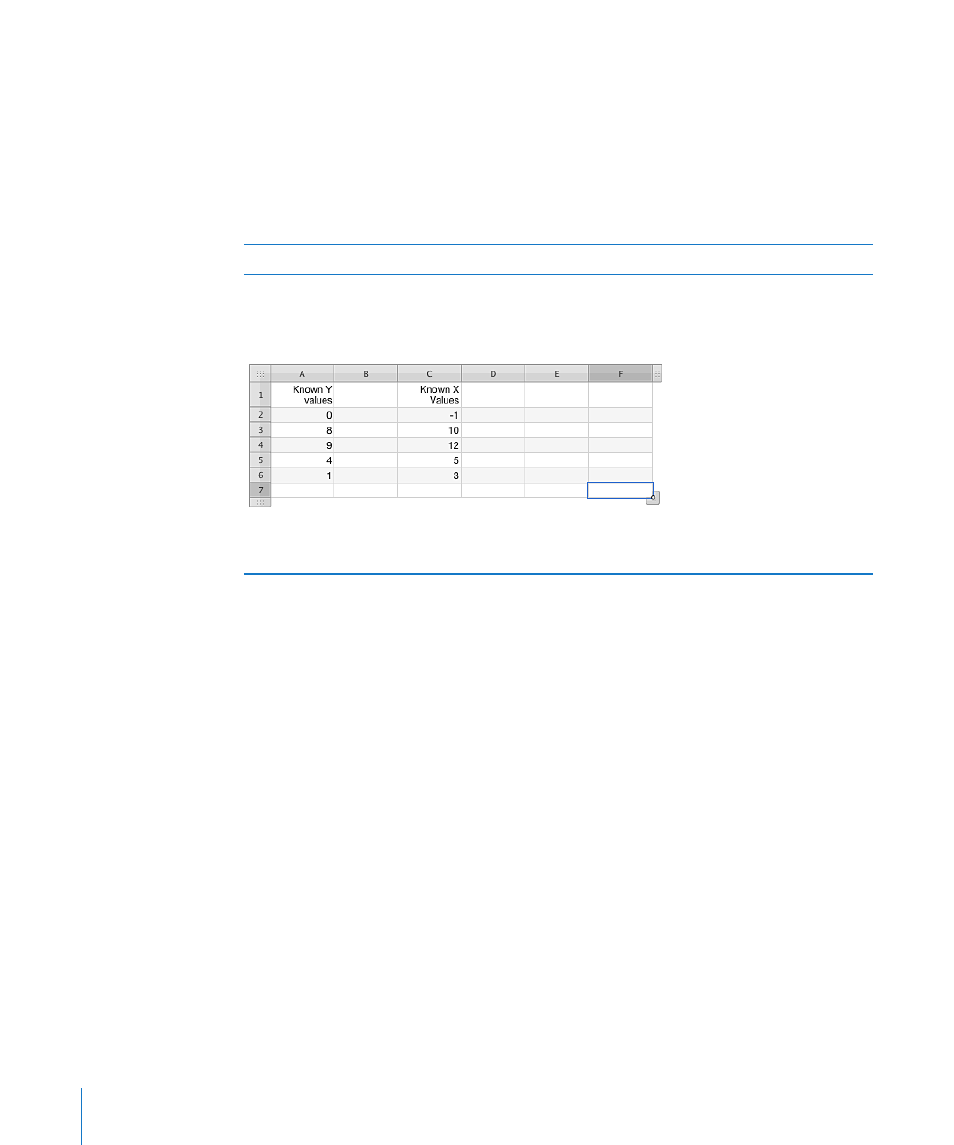
Assume the following table contains the test scores of 30 students who recently took an exam you
administered. Assume further that the minimum passing grade is 65 and that the lowest score for
other grades are as given. In order to facilitate building the formulas, an “F” is represented by 1 and
an “A” by 5.
=INDEX(LINEST(A2:A6, C2:C6, 1, 0), 1) returns 0.752707581227437, which is the best-fit line slope.
=INDEX(LINEST(A2:A6, C2:C6, 1, 0), 2) returns 0.0342960288808646, which is b, the intercept.
Related Topics
For related functions and additional information, see:
“Listing of Statistical Functions” on page 225
“Value Types” on page 36
“The Elements of Formulas” on page 15
“Using the Keyboard and Mouse to Create and Edit Formulas” on page 26
“Pasting from Examples in Help” on page 41
266
Chapter 10
Statistical Functions