HP 50g Graphing Calculator User Manual
Page 613
Page 18-46
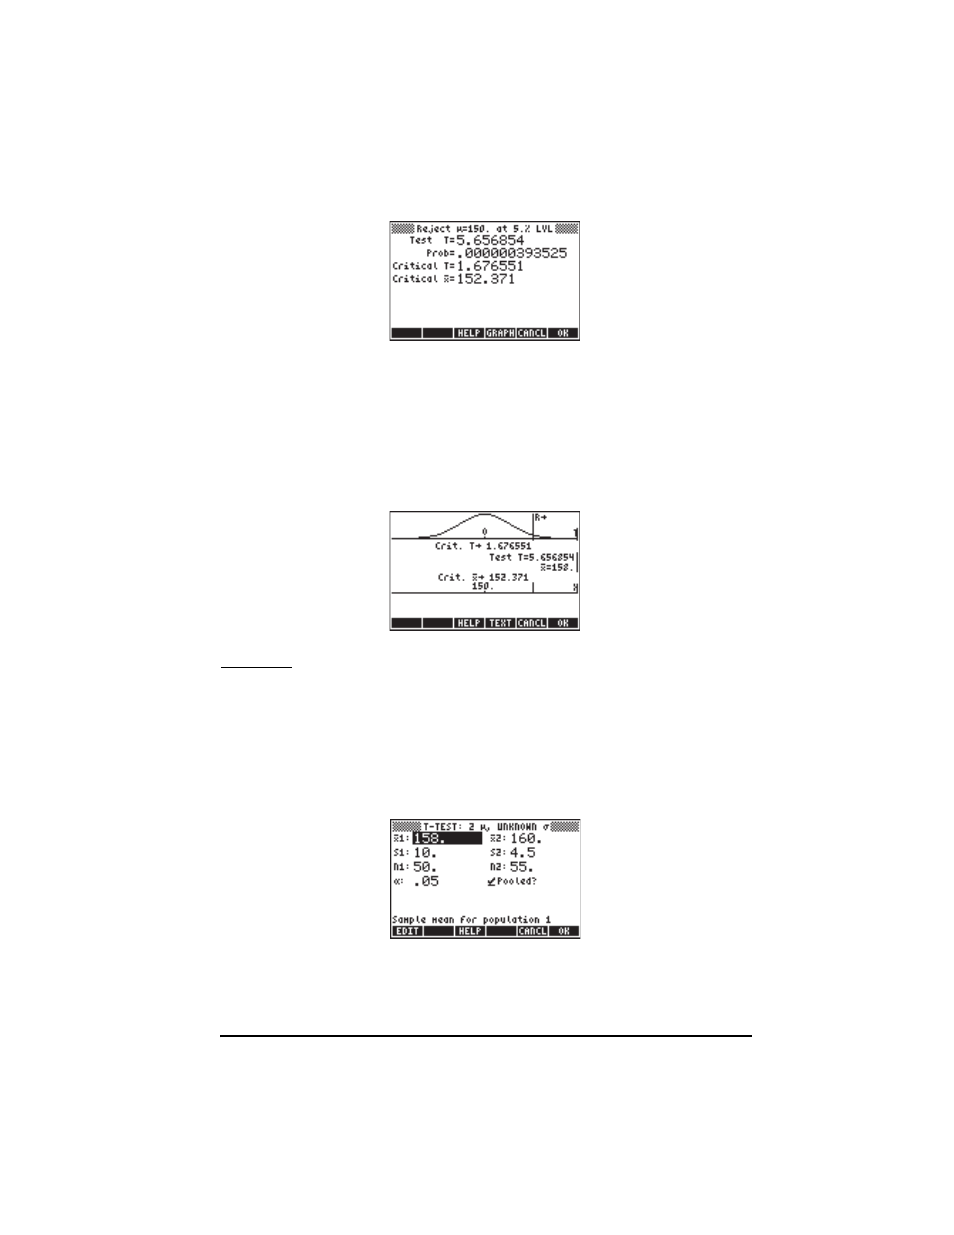
We reject the null hypothesis, H
0
:
μ
0
= 150, against the alternative hypothesis,
H
1
:
μ > 150. The test t value is t
0
= 5.656854, with a P-value =
0.000000393525. The critical value of t is t
α
= 1.676551, corresponding to a
critical
⎯x = 152.371.
Press
@GRAPH to see the results graphically as follows:
Example 3 – Data from two samples show that
⎯x
1
= 158,
⎯x
1
= 160, s
1
= 10,
s
2
= 4.5, n1 = 50, and n
2
= 55. For
α = 0.05, and a “pooled” variance, test
the hypothesis H
0
:
μ
1
−μ
2
=
0, against the alternative hypothesis, H
1
:
μ
1
−μ
2
<
0.
Press
‚Ù—— @@@OK@@@ to access the hypothesis testing feature in the
calculator. Press
—@@@OK@@@ to select option 6. T-Test: μ1−μ2.: Enter the
following data and press
@@@OK@@@:
Select the alternative hypothesis
μ1< μ2, and press @@@OK@@@. The result is