HP 50g Graphing Calculator User Manual
Page 598
Page 18-31
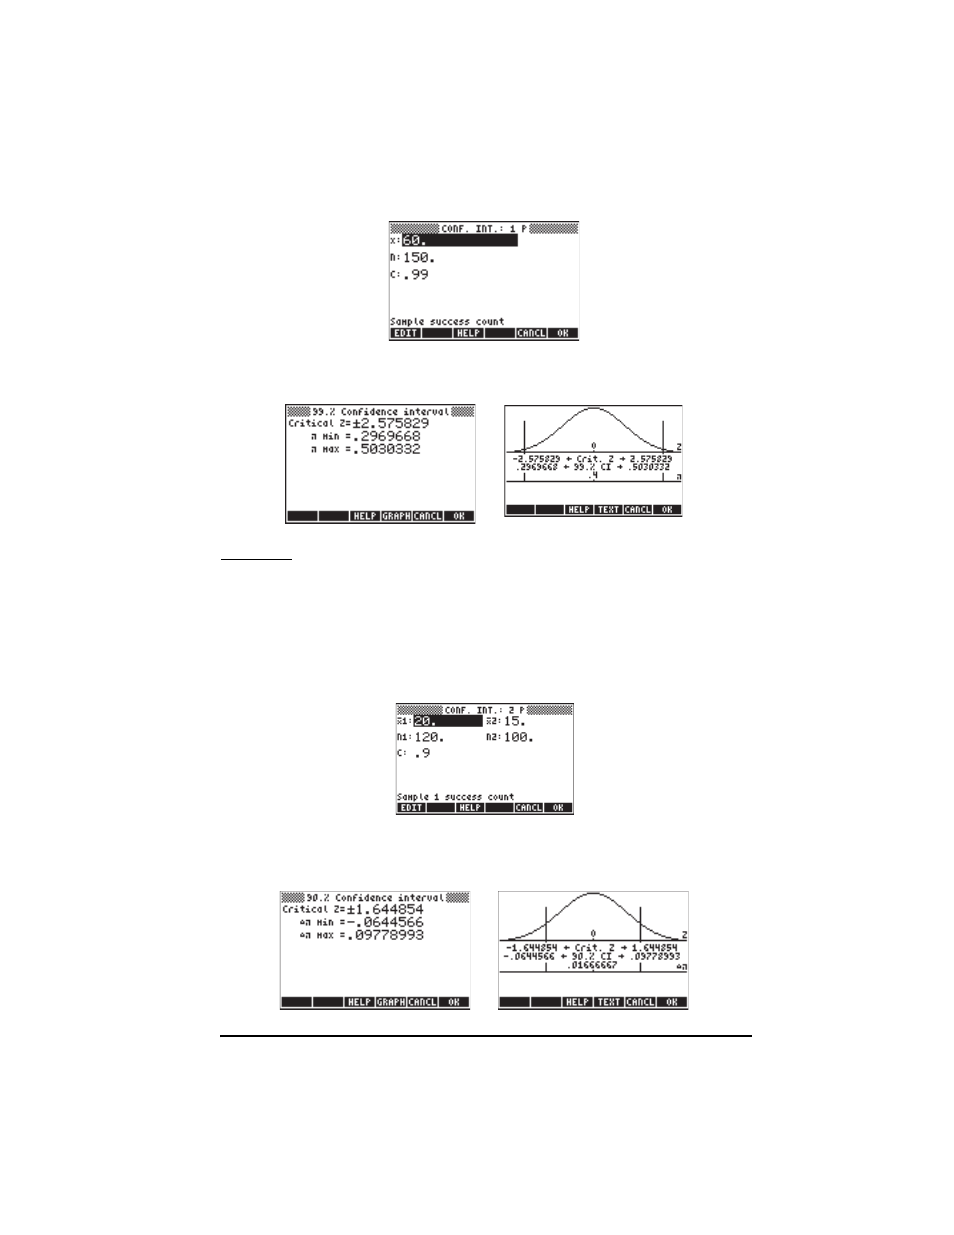
When done, press
@@@OK@@@. The results, as text and graph, are shown below:
Example 4 -- Determine a 90% confidence interval for the difference between
two proportions if sample 1 shows 20 successes out of 120 trials, and sample
2 shows 15 successes out of 100 trials.
Press
‚Ù—@@@OK@@@ to access the confidence interval feature in the
calculator. Press
˜˜˜@@@OK@@@ to select option 4. Z-INT: p1 – p2.. Enter
the following values:
When done, press
@@@OK@@@. The results, as text and graph, are shown below: