HP 50g Graphing Calculator User Manual
Page 587
Page 18-20
@)STAT @)£PAR @RESET
resets statistical parameters
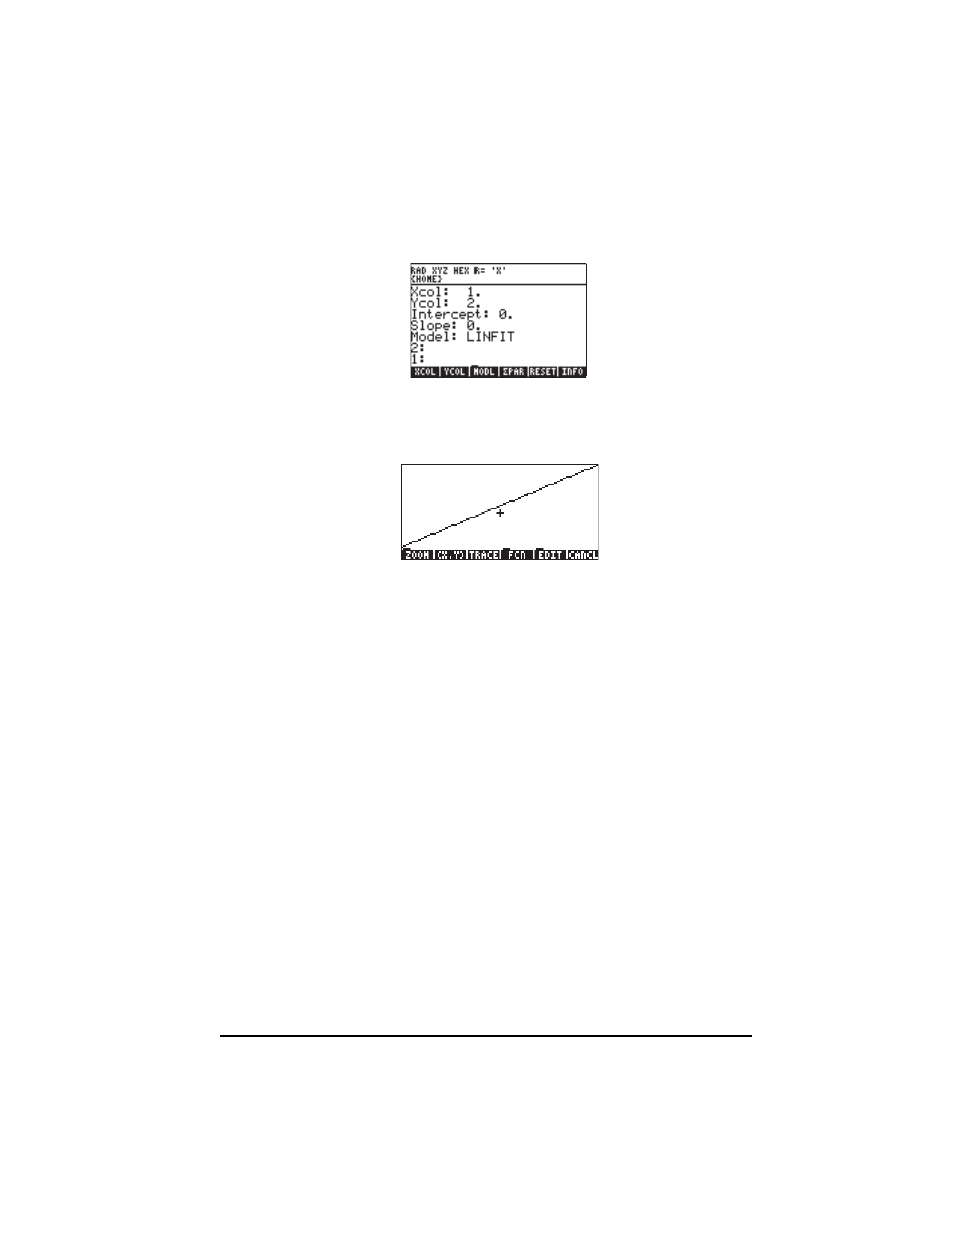
L @)STAT @PLOT @SCATR
produces scatterplot
@STATL
draws data fit as a straight line
@CANCL
returns to main display
Θ Determine the fitting equation and some of its statistics:
@)STAT @)FIT@ @£LINE
produces
'1.5+2*X'
@@@LR@@@
produces
Intercept: 1.5, Slope: 2
3
@PREDX
produces 0.75
1
@PREDY
produces 3. 50
@CORR
produces 1.0
@@COV@@
produces 23.04
L@PCOV
produces 19.74…
Θ Obtain summary statistics for data in columns 1 and 2: @)STAT @)SUMS:
@@@£X@@
produces 38.5
@@@£Y@@
produces 87.5
@@£X2@
produces 280.87
@@£Y2@
produces 1370.23
@@£XY@ produces
619.49
@@@N£@@
produces 7