HP 50g Graphing Calculator User Manual
Page 588
Page 18-21
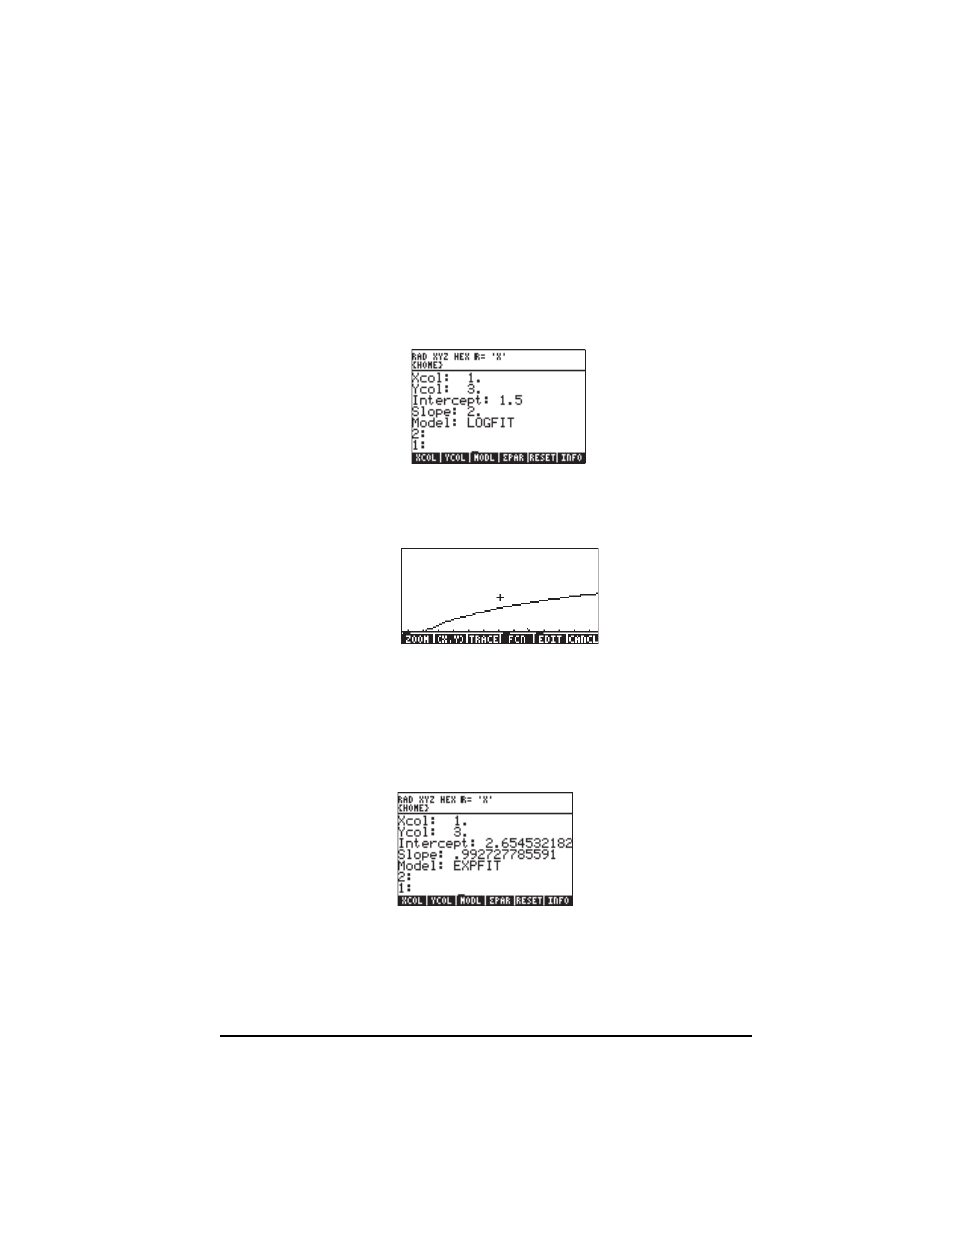
Θ Fit data using columns 1 (x) and 3 (y) using a logarithmic fitting:
L @)STAT @)£PAR 3 @YCOL
select Ycol = 3, and
@)MODL @LOGFI
select Model = Logfit
L @)STAT @PLOT @SCATR
produce scattergram of y vs. x
@STATL
show line for log fitting
Obviously, the log-fit is not a good choice.
@CANCL
returns to normal display.
•
Select the best fitting by using:
@)STAT @£PAR @)MODL @BESTF
shows EXPFIT as the best fit for these data
L@)STAT @)FIT @£LINE
produces '2.6545*EXP(0.9927*X)'
@CORR
produces 0.99995… (good correlation)
2300
@PREDX
produces 6.8139
5.2
@PREDY
produces 463.33