Viewing lu path transfer rates, 34 i/o rates for lu paths, Figure 34 – HP XP Array Manager Software User Manual
Page 71

7.
To display a graph to find out how the I/O rate has been changed, take the following steps;
a.
In the list, select one or more LUNs.
b.
Select the Draw button.
Note:
If the graph does not display changes in the I/O rate (for example, if the line in the
graph runs vertically), it is recommended that you change the value in the Chart Y Axis Rate
drop-down list. For example, if the largest value in the list is 200 and the value in Chart Y
Axis Rate is 100, you should select a value larger than 200 from Chart Y Axis Rate.
8.
To view more detailed information in the graph, select the Detail check box at the lower
right of the list. The graph contents change as described in
on page 42 of
Port-LUN Tab of the Auto LUN Window
Note:
If more than one row is selected in the list, you cannot select the Detail check box.
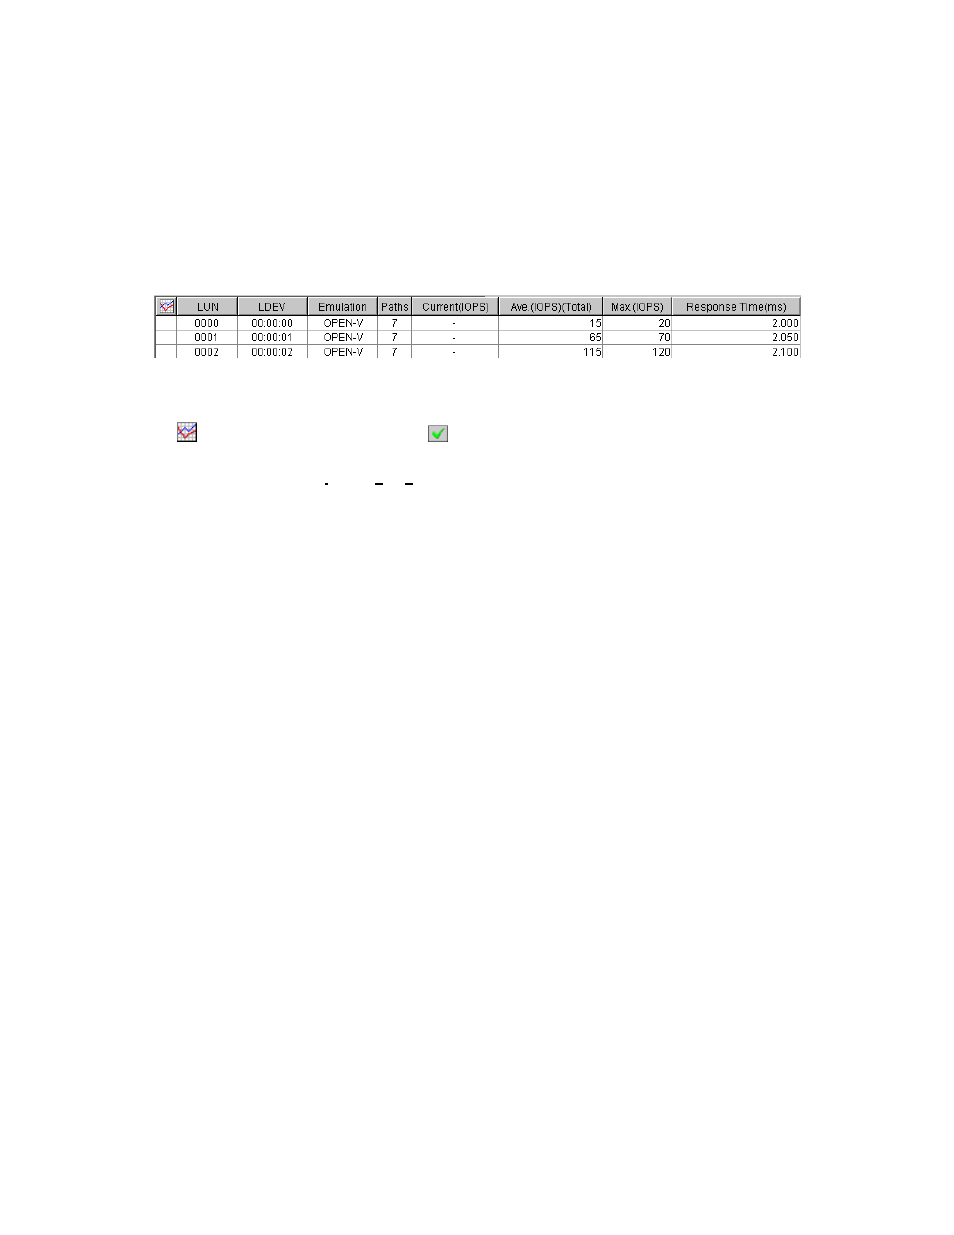
Figure 34 I/O Rates for LU Paths
The list displays the following:
•
: When the green check box icon
is displayed on the left of an item, the graph displays
changes in workload statistics about the item.
•
LUN: Indicates LUNs (logical unit numbers).
•
LDEV: Indicates IDs of volumes. The number on the left of the first colon from the left is the LDKC
number. The number on the left of the second colon from the left is the CU image number.
The number on the right of the second colon is the LDEV number. The symbol # at the end of
numbers indicates the volume is an external volume. The symbol V or X at the end of numbers
indicates the volume is a virtual volume.
•
Emulation: Indicates emulation types.
•
Paths: Indicates the number of LU paths (that is, paths to volumes).
•
Current: Indicates the current I/O rate.
•
Ave.: Indicates the average I/O rate for the specified period.
•
Max.: Indicates the maximum I/O rate for the specified period.
•
Response Time: This column indicates the time for replying from the LU path when I/O accesses
are made from the host to the LU path. The unit is milliseconds. The average response time in the
period specified at Monitoring Term is displayed.
Viewing LU Path Transfer Rates
Performance Monitor monitors LU paths and measures transfer rates (that is, the size of data transferred
in one second).
To view transfer rates:
1.
Ensure that the Auto LUN window is displayed.
2.
Select the Port-LUN tab (
The tree displays a list of ports on the storage system.
3.
Select MB/s from the drop-down list on the right side of the window.
4.
In Monitoring Term, do one of the following:
• To view the transfer rate in real time, you must select the Real Time option, specify the number
of recent collections of statistics which should be displayed in the graph, and then click Apply.
• To view transfer rates for a certain period of time in the last 24 hours, you must select the From
option, change the date and time in the From and To boxes, and then click Apply. Use the
arrow button and the sliders when you change the date and time in the From and To boxes.
For details on the Real Time option and the From option, see
Port-LUN Tab of the Auto LUN Window
XP24000 Performance Monitor User's Guide
71
