Figure 6 – HP XP Array Manager Software User Manual
Page 31

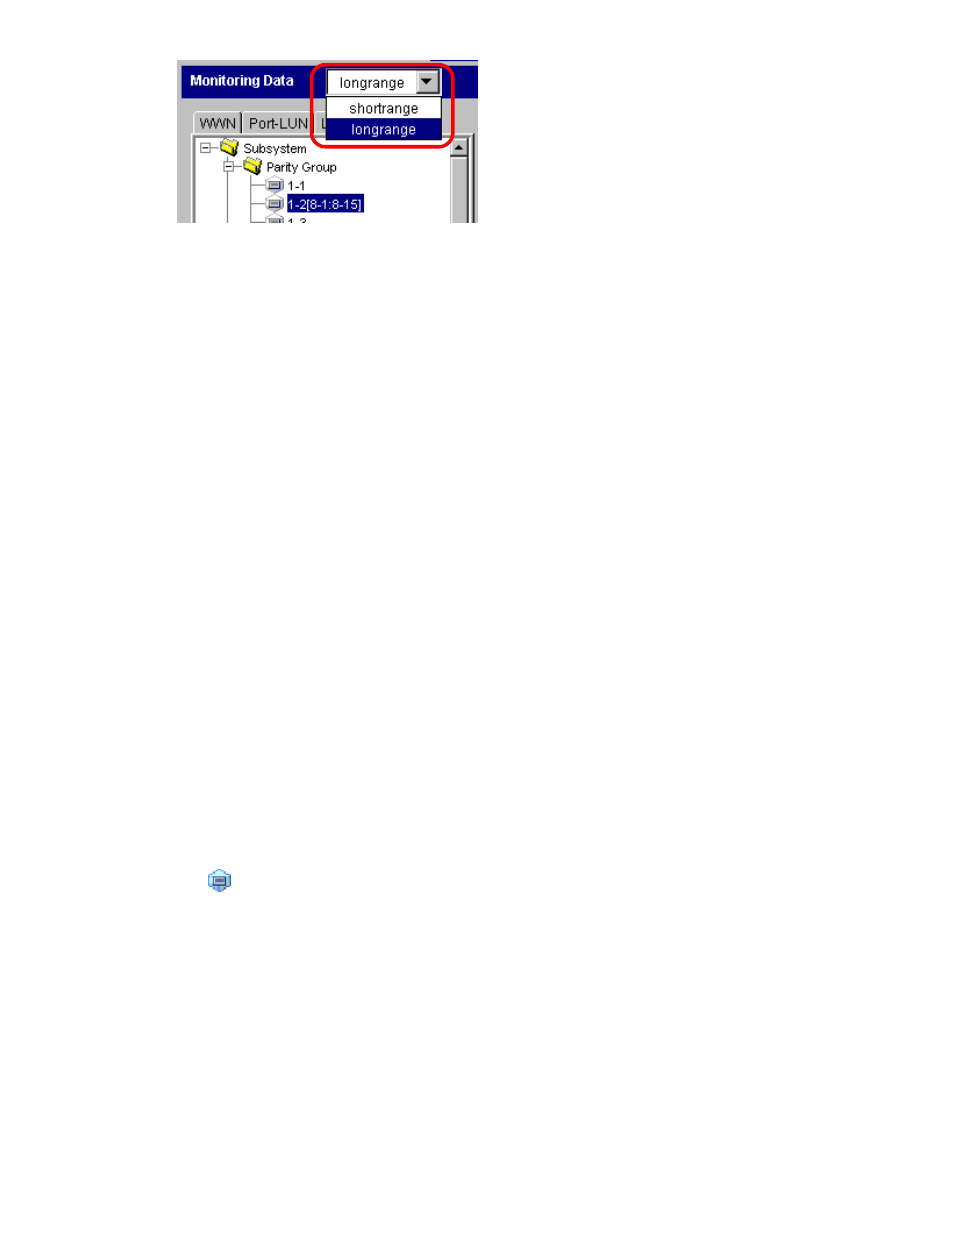
Figure 6 The Drop-Down List to Select Storing Period of Statistics (Physical Tab)
The storing period of statistics is the range of monitoring data (statistics collected by monitoring)
that can be displayed. You can specify a part of term within the selected range to narrow the
statistics to be displayed in the list and graph on the Auto LUN window.
The differences in selecting shortrange and longrange are de
scribed in “
When you select Long-Range Storage
” on page 34 and
When you select Short-Range Storage
•
Monitoring Term lets you narrow the range of usage statistics that should be displayed in the
window.
Starting and ending times for collecting statistics are displayed on both sides of the slide bar.
Performance Monitor stores the monitoring data between these times, and you can specify desired
term within this range as the target of display in lists and graphs.
For example, if you want to view usage statistics within the range of 10:30 July 1 2006 to 22:30
July 31 2006, you set 2006/07/01 10:30 to the From box, set 2006/07/31 22:30 to
the To box, and then click the Apply button.
To set a date and time to the From and To boxes, do either of the following:
• Move the slider to the left or to the right.
• In the text box, select the number that you want to change. Next, click the upward or
downward arrow button.
When you specify dates and time in From and To boxes, Performance Monitor calculates the
length of the specified period and displays the calculated length. The length of the period is
displayed in days when you select longrange, and it is displayed in minutes when you select
shortrange.
Notes:
• The
From and To boxes are grayed out if the monitoring data (that is, usage statistics) is
not stored in the storage system.
• The
Real Time option is grayed out when the Physical tab is active.
•
In the Monitoring Data area, the drop-down list on the upper right of the list specifies the type
of statistics to be displayed in the window. When the Physical tab is active, the drop-down
list contains only one entry (that is, Usage).
•
The tree lists items such as parity groups, channel adapters (CHAs). The tree can display the
following items.
• Icon displayed below the Parity Group or External Group folder:
a parity group or an external volume group
• Icons displayed below the CHA folder:
XP24000 Performance Monitor User's Guide
31
