Monitoring hard disk drives, Figure 29 – HP XP Array Manager Software User Manual
Page 61
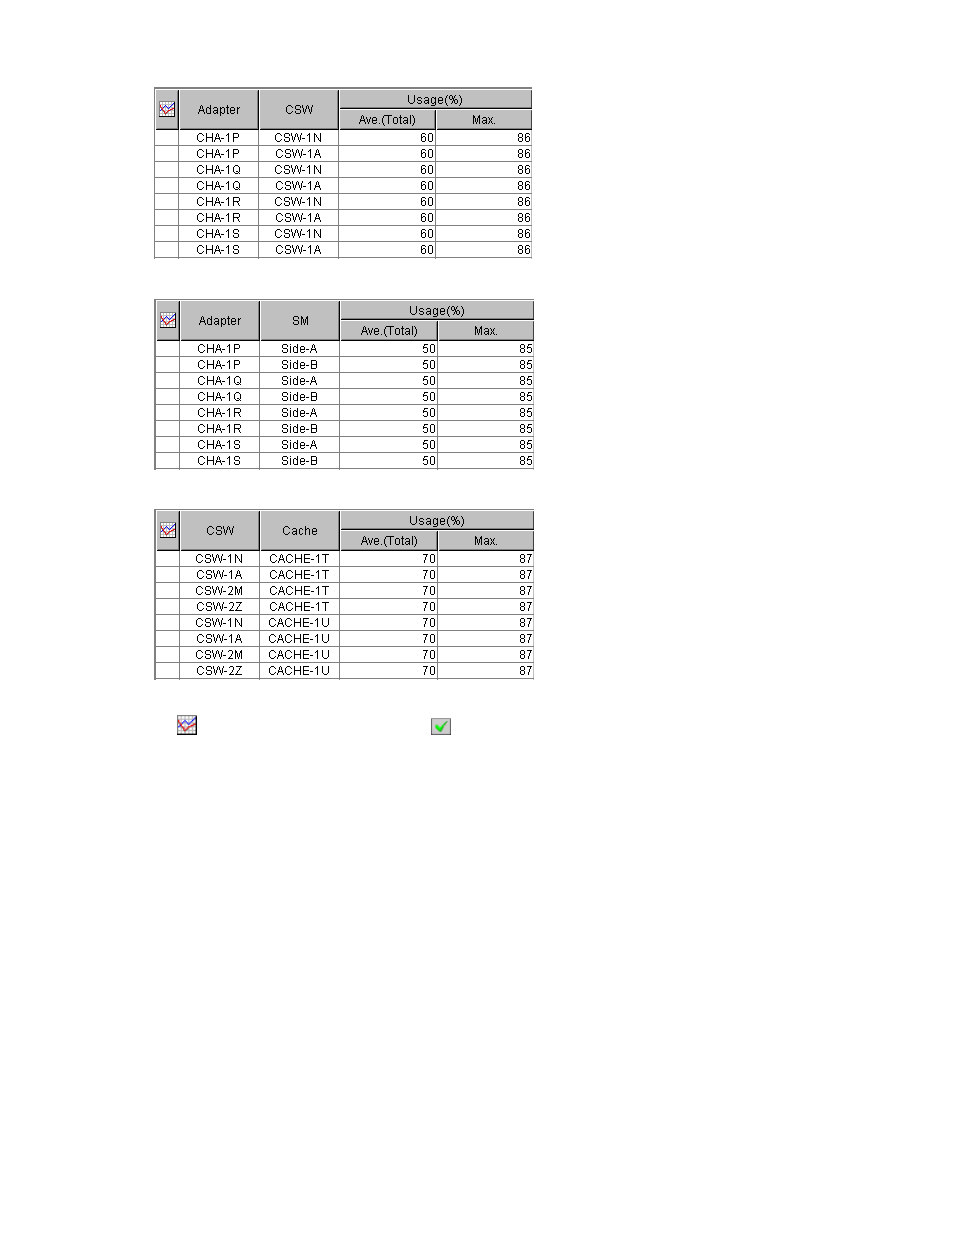
Paths between adapters and cache switches:
Paths between adapters and shared memories:
Paths between cache switches and cache memory:
Figure 29 Examples of Usage Statistics Displayed in the List
•
: When the green checkmark icon
is displayed on the left of the access path, the graph
illustrates changes in usage rate for the access path.
•
Adapter: This column indicates adapters.
•
CSW: This column indicates cache switches.
•
SM: This column indicates shared memories.
•
Cache: This column indicates the cache memories.
•
Usage:
• The
Ave. (Total) column displays the average usage rate for the specified period.
• The
Max. column displays the maximum usage rate for the specified period.
Monitoring Hard Disk Drives
The LDEV tab of the Auto LUN window lets you check workloads on physical hard disk drives (parity
groups) or on volumes. The LDEV tab displays the I/O rate and the transfer rate. The I/O rate indicates
the number of disk I/Os per second. The transfer rate indicates the size of data transferred to the
disk in one second.
In addition, the LDEV tab displays the read hit ratio and the write hit ratio. For a read I/O, when the
requested data is already in cache, the operation is classified as a read hit. For a write I/O, when the
requested data is already in cache, the operation is classified as a write hit.
XP24000 Performance Monitor User's Guide
61