Figure 23 – HP XP Array Manager Software User Manual
Page 55
change the date and time in From and To boxes, use the arrow buttons and the sliders (for
details, see “
6.
To display a graph that illustrates changes in usage rate for external volumes, select the desired
external volumes in the list and then click the Draw button.
Note:
The range of monitoring and the gathering interval affects the time period represented by
a graduation on the horizontal axis.
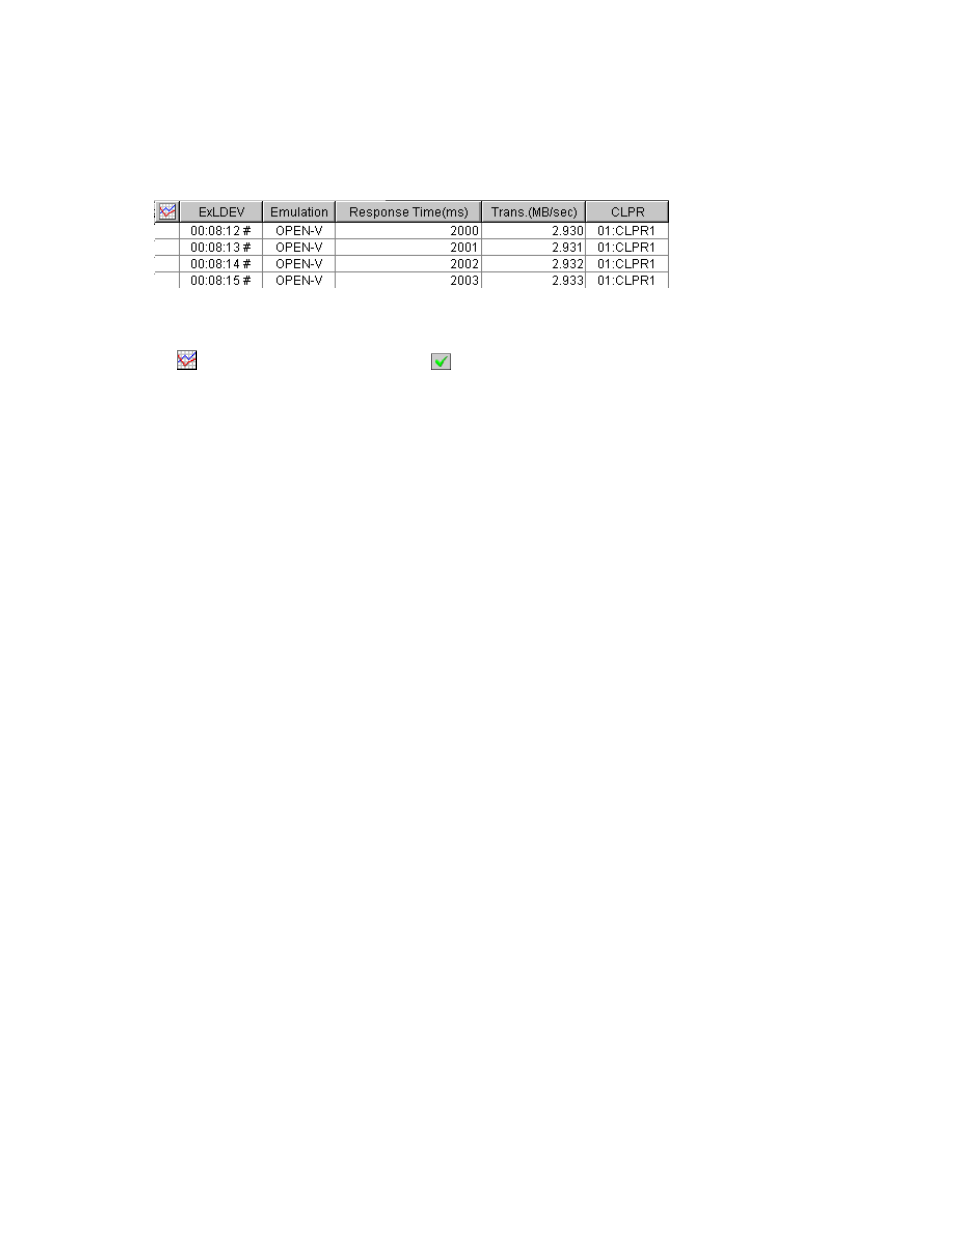
Figure 23 An Example of External Volume Usage Rates Displayed
The list displays the following items:
•
: When the green checkmark icon
is displayed on the left of a external volume, the graph
illustrates changes in usage rate for the external volume.
•
ExLDEV: This column indicates external volumes. The number on the left of the first colon from
the left is the LDKC number. The number on the left of the second colon from the left is the CU
image number. The number on the right of the second colon is the LDEV number. The symbol # at
the end of numbers indicates the volume is an external volume.
•
Emulation: This column indicates device emulation types.
•
Response Time: This column indicates the time for replying from an external volume when I/O
accesses are made from storage system to the external volume. The unit is milliseconds. The
average response time in the period specified at Monitoring Term is displayed.
•
Trans.: This column indicates the sizes of data transferred between the storage system and the
external volume in one second.
•
CLPR: This column indicates numbers and names of CLPRs corresponding to each external volume
group which the external volume belongs to, in the format CLPR-number:CLPR-name. For details
on CLPRs, see HP StorageWorks XP24000 Disk/Cache Partition User’s Guide.
Viewing Usage Statistics about Channel Processors (CHPs)
Performance Monitor monitors channel processors in each channel adapter and lets you view the average
and the maximum usage rate in a specified period. Performance Monitor also displays a graph that
illustrates changes in channel processor usage within that period.
To view usage statistics about channel processors:
1.
Ensure that the Auto LUN window is displayed.
2.
In the tree, click the Physical tab.
3.
In the drop-down list above the tree, select the storing period of statistics from longrange and
shortrange for display.
For details on the types of storing period of statistics, see
Understanding Statistical Storage Ranges
When you view usage statistics about channel processors, the items displayed in the list by
selecting longrange and shortrange are the same.
4.
In the tree, do one of the following:
• To
view usage statistics about all the channel processors in your storage system, select the
Client-Host Interface Processor (CHIP) folder.
• To view usage statistics about channel processors in a channel adapter, double-click the
Client-Host Interface Processor (CHIP) folder and then select the desired channel adapter.
The list on the right displays usage statistics about the channel processors (
The displayed statistics are the average and the maximum usage rates for the period specified
in the From and To boxes.
XP24000 Performance Monitor User's Guide
55