HP XP Array Manager Software User Manual
Page 40
•
The Real Time option lets you view statistics in real-time mode, where statistics are updated at
a gathering interval you specify between 1 and 15 minutes.
When you select the Real Time option, use the drop-down list to select the number of recent
collections of statistics which should be displayed in the graph. You can select the number of
times from 5 or 90. This setting determines the range of recent statistics to be displayed in the
graph. For example, suppose the gathering interval is 1 minute. In this case, if you select 90
from the drop-down list, the graph displays statistics obtained in the last 90 minutes (multiplying 1
minute by 90 times).
•
In the Monitoring Data area, the drop-down list on the upper right of the list specifies the type of
statistics to be displayed in the window. To view I/O rates, select IOPS (I/Os per second) from the
drop-down list. To view transfer rates, select MB/s (megabytes per second) from the drop-down list.
•
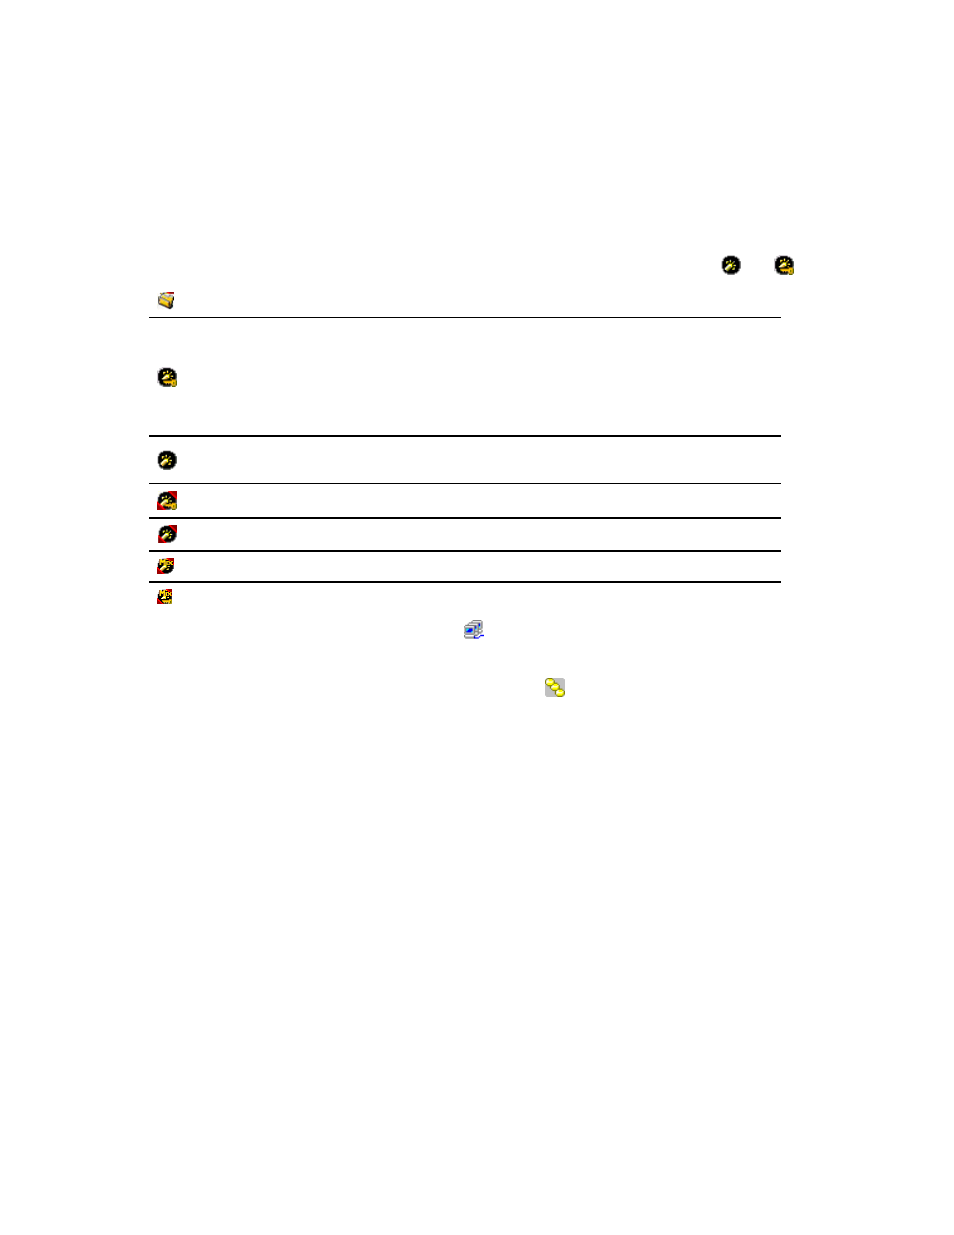
The tree contains the Subsystem folder. Below the Subsystem folder are ports (such as
and ):
This icon indicates the attribute of the stored port is Target, or Initiator/External.
This port icon indicates either of the following:
•
A Fibre Channel port in Standard mode. LUN security is applied to this port.
If the port name is followed by its fibre address, the port is a Fibre Channel port. For example,
CL1-A(EF) indicates that the CL1-A port is a Fibre Channel port.
Note:
For detailed information about LUN security, see HP StorageWorks XP24000 LUN
Manager User’s Guide.
This port icon indicates either of the following:
•
A Fibre Channel port in Standard mode. LUN security is not applied to this port.
A Fibre Channel port in High Speed mode. LUN security is applied to this port.
A Fibre Channel port in High Speed mode. LUN security is not applied to this port.
A Fibre Channel port in Initiator/External MIX mode. LUN security is not applied to this port.
A Fibre Channel port in Initiator/External MIX mode. LUN security is applied to this port
When you double-click a port, the host groups ( ) that correspond to that port are displayed. The
host group ID appears on the left of the colon (:). The host group name appears on the right of the
colon. For details on host groups, see HP StorageWorks XP24000 LUN Manager User’s Guide.
When you double-click a host group, an item named LUN ( ) appears. When you select LUN,
the list on the right lists LU paths. For details on LU paths, see HP StorageWorks XP24000 LUN
Manager User’s Guide.
•
The list displays statistics (that is, I/O rates, transfer rates, or average response time). For details
on the list contents, see “
” on page 66 and “
•
The Draw button displays a line graph that illustrates changes in the I/O rate or the transfer rate.
The graph can display up to eight lines simultaneously.
•
The line graph illustrates changes in the I/O rate or the transfer rate. The vertical axis indicates
the I/O rate or the transfer rate. The horizontal axis indicates dates and/or times.
When the graph displays I/O rates or the transfer rates for a port controlled by an upper limit or
a threshold, the graph also displays a line that indicates the upper limit or the threshold.
When you draw a graph, use the Detail check box and the drop-down list to illustrate the desired
information, and use the Chart Y Axis Rate drop-down list to arrange the graph convenient to work.
40
Using the Performance Monitor GUI