Figure 20 – HP XP Array Manager Software User Manual
Page 51
Note:
It is possible that the usage rate for a parity group is not equal to the sum of the usage rate for each
volume in that parity group (see “
Viewing Usage Statistics about Volumes in Parity Groups
This is because the Auto LUN window rounds off fractions below the decimal point to the nearest whole
number when displaying the usage rate for each volume.
Note
: If there is no volume in a parity group, hyphens (-) are displayed in place of performance
statistics on a parity group.
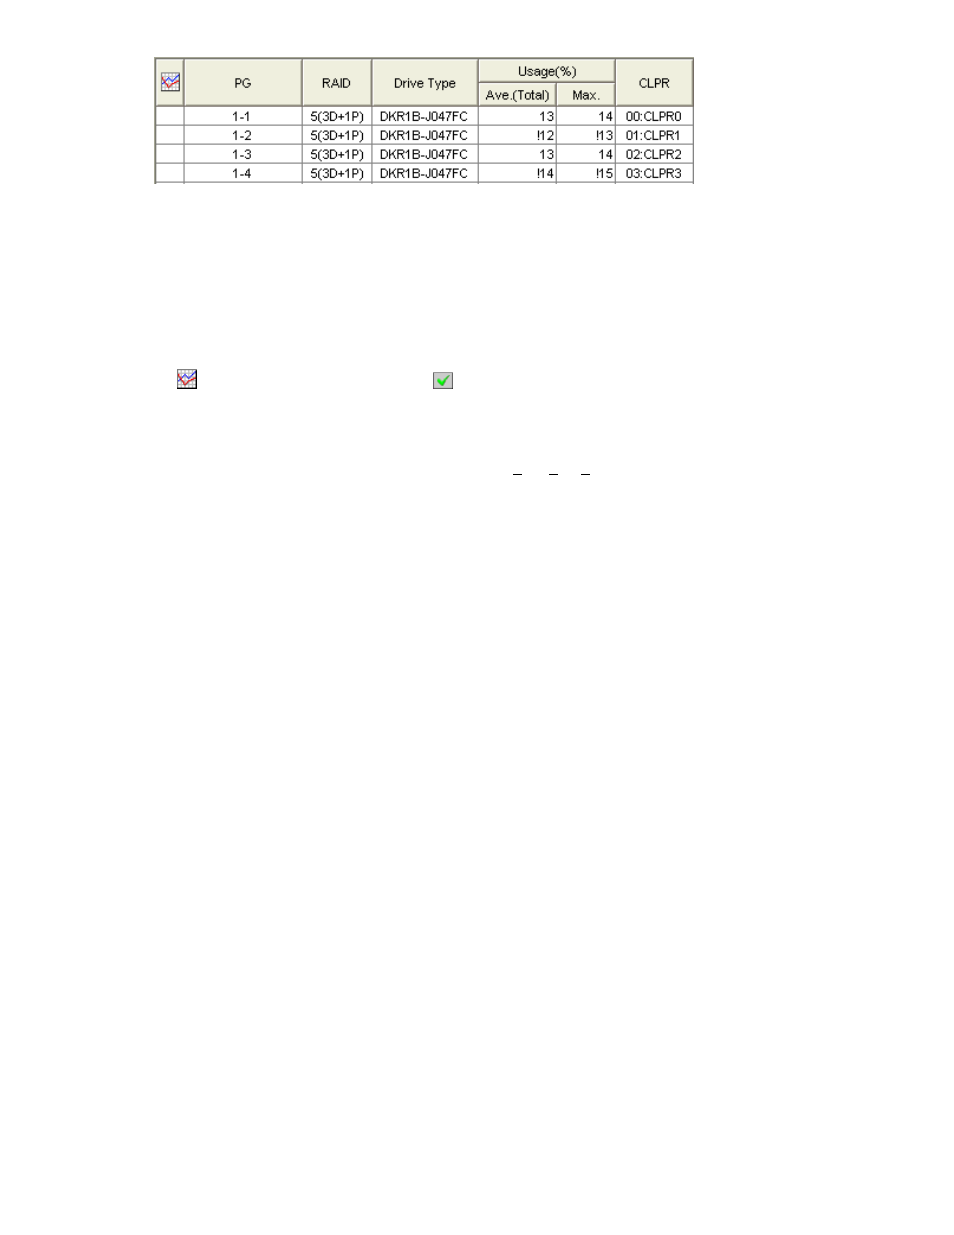
Figure 20 An Example of Parity Group Usage Rates Displayed in the List
The list displays the following items:
•
: When the green checkmark icon
is displayed to the left of a parity group, the graph
illustrates changes in usage rate for the parity group.
•
PG: This column indicates IDs of parity groups.
•
RAID: This column indicates the RAID level (RAID-1, RAID-5, or RAID-6).
•
Drive Type: This column indicates types of HDDs (h
ard disk drives).
•
Usage:
• The
Ave. (Total) column displays the average usage rate in the specified period.
• The
Max. column displays the maximum usage rate in the specified period.
•
CLPR: This column indicates numbers and names of cache logical partitions (CLPRs) corresponding
to each parity group in the format CLPR-number:CLPR-name. For details on CLPRs, see HP
StorageWorks XP24000 Disk/Cache Partition User’s Guide.
Viewing Usage Statistics about Volumes in Parity Groups
Performance Monitor monitors volumes in parity groups and lets you view the average and the maximum
usage rate in a specified period. Performance Monitor also displays a graph that illustrates changes in
volume usage within that period.
To view usage statistics about volumes in a parity group:
1.
Ensure that the Auto LUN window is displayed.
2.
In the tree, click the Physical tab
3.
In the drop-down list above the tree, select the storing period of statistics from longrange and
shortrange for display.
For details on the types of storing period of statistics, see
Understanding Statistical Storage Ranges
When you view usage statistics about volumes, some items displayed in the list differ depending
on the selection of the storing period: longrange or shortrange. To use Auto LUN to migrate
volumes, select longrange. This enables you to confirm the estimated usage rate of parity
groups after migration.
To examine the ratio of Business Copy processing and so on to all the processing in the physical
drive, select shortrange.
Note:
The usage statistics for a same term might be slightly different between selecting
shortrange and longrange because the monitoring precision of these two interval types differs.
Especially, differences in read rates and write rates between the interval types are larger than
other usage statistics.
4.
In the tree, double-click the Parity Group folder.
The folder opens and a list of parity groups is displayed below the folder.
5.
Select the desired parity group.
XP24000 Performance Monitor User's Guide
51