Viewing port workload statistics, Item to be displayed (port-lun tab) – HP XP Array Manager Software User Manual
Page 41
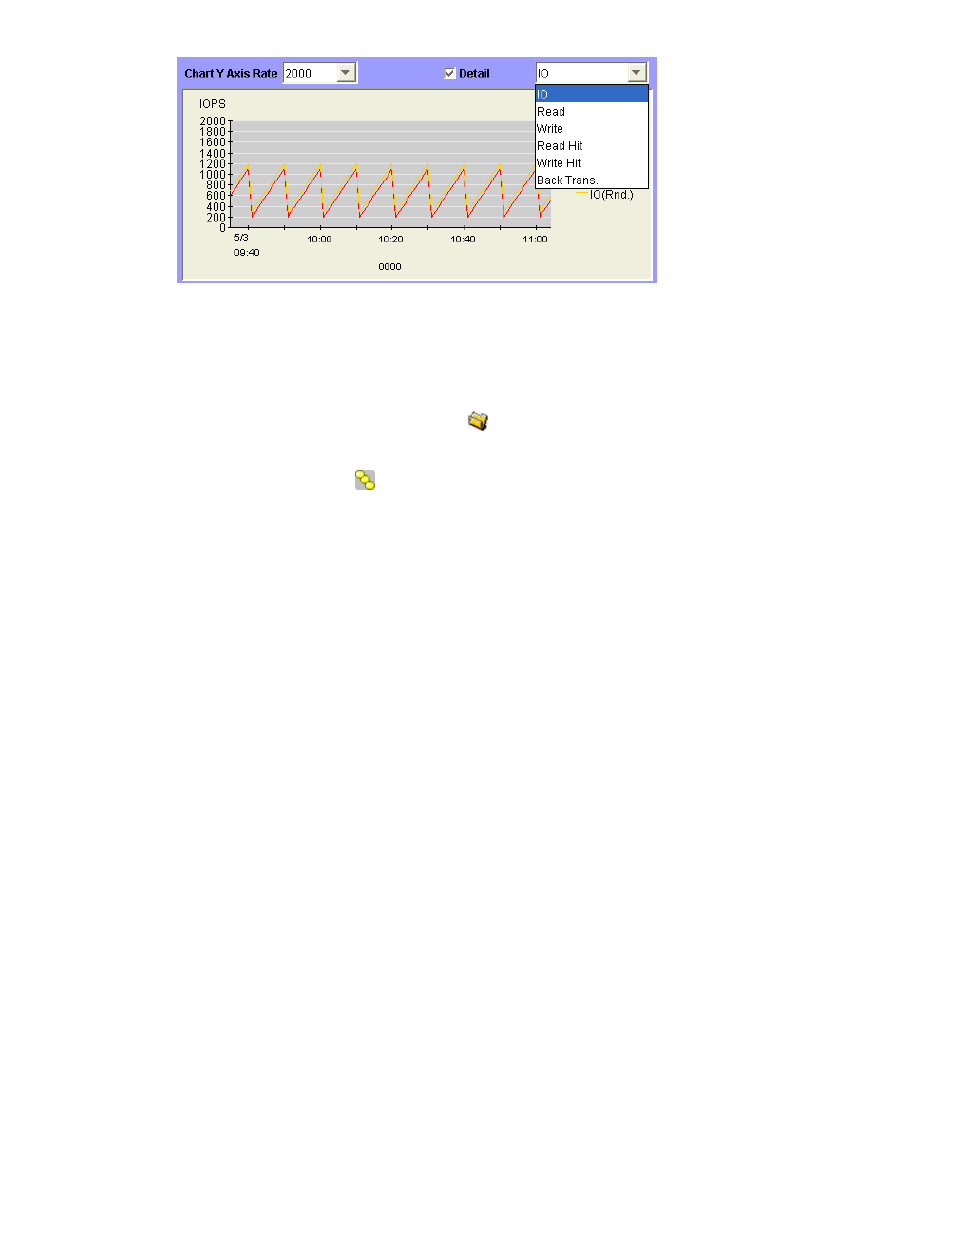
Figure 13 Chart Y Axis Rate Drop-Down List, Detail Check Box, and the Drop-Down
List to Select the Item to be Displayed (Port-LUN Tab)
The Chart Y Axis Rate drop-down list lets you select the highest value of the Y-axis (the vertical
axis) of the graph.
If you select the Detail check box after drawing a graph by selecting the Draw button, the graph
displays detailed statistics as explained. The detailed statistics can be displayed only:
• When
you
select
the
Subsystem folder (
) in the tree and select a port in the list.
The graph displays detailed statistics about workloads on the port selected in the list. For
details on the graph, see Detail Statistics about Workload on a Port below.
• When
you
select
LUN ( ) in the tree and select a LUN (an address of a volume) in the list.
The graph displays detailed statistics about workloads on the LU path selected in the list. The
information in the graph depends on the item selected in the drop-down list on the right of
the Detail check box. For details on the graph see Detail Statistics about Workload on an
LU Path below.
Viewing Port Workload Statistics
on page 42 shows an example of a graph displaying about workload of a port. In this
example, the user selected the port CL1-A in the list and then select Draw. Note that, in this example, 1
minute is specified as the gathering interval. The graph contents changes depending on the selection of
the Detail check box as explained in
on page 42. The figure shows the following:
•
The workload on the port CL1-A is 200 IO/s at 8:00, and 300 IO/s at 10:00 (see the graph
on the left).
•
For the period of 7:59 to 8:00, the maximum workload on CL1-A is 300 IO/s. The average
workload on CL1-A is 200 IO/s. The minimum workload on CL1-A is 100 IO/s (see the graph on
the right).
•
For the period of 9:59 to 10:00, the maximum workload on CL1-A is 400 IO/s. The average
workload on CL1-A is 300 IO/s. The minimum workload on CL1-A is 200 IO/s (see the graph
on the right).
•
When Detail is deselected, only one line appears in the graph. This line is equivalent to the line
Ave. (1 min), which appears when Detail is selected.
XP24000 Performance Monitor User's Guide
41