Sizing for service level objectives, Figure 4 – HP Matrix Operating Environment Software User Manual
Page 19
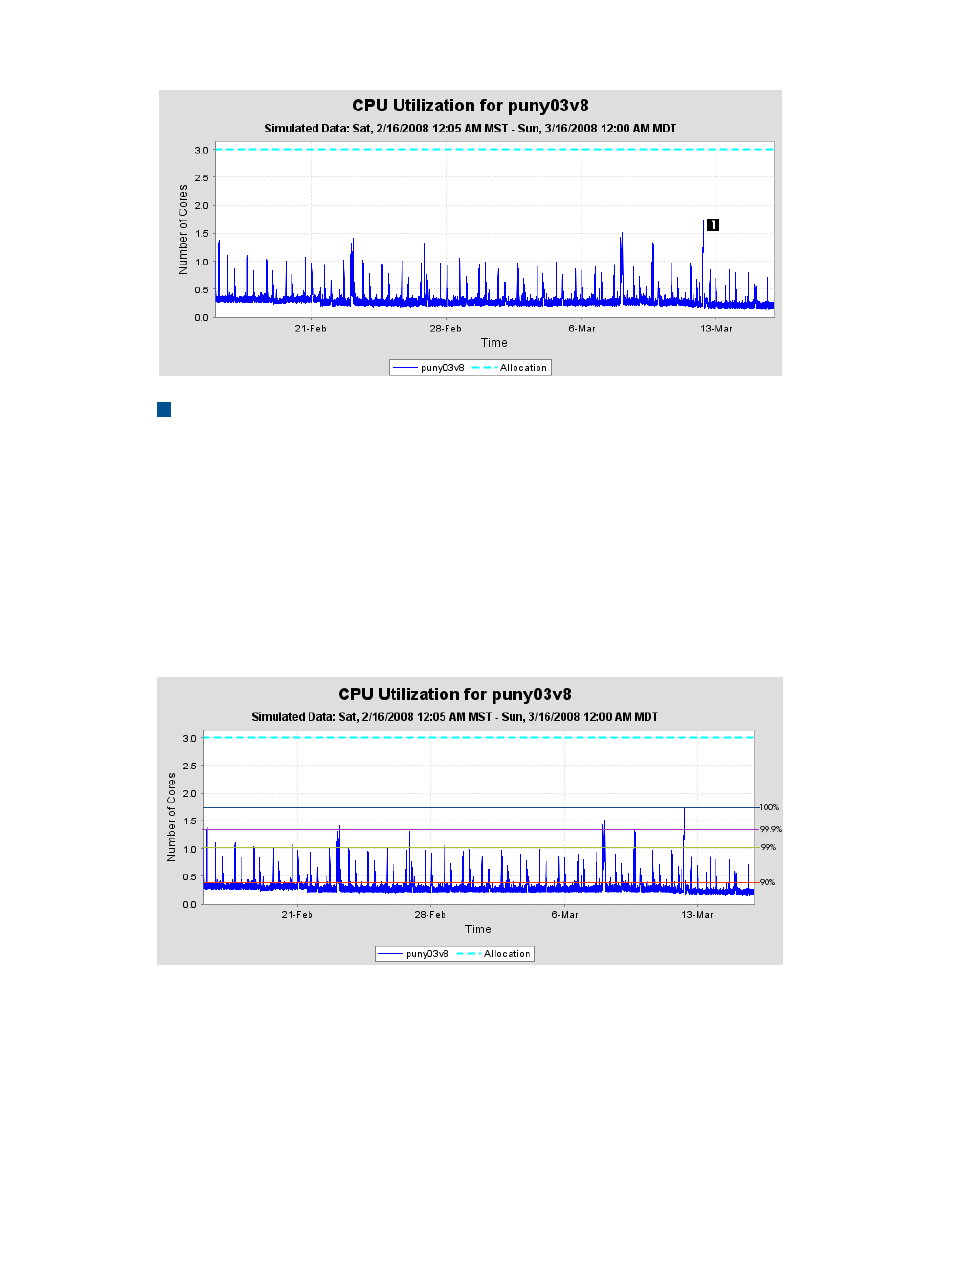
Figure 4 Combined “what-if” CPU utilization for puny03v8 and puny03v7
1
Peak value.
From the graph, it is evident that the peak of the combined workloads is under 2 CPU cores. Even
with utilization limits in place, this system is unlikely to need 4 CPU cores to meet this workload
demand.
Sizing for service level objectives
As part of planning configuration changes, you can also consider your service level objectives or
quality of service goals.
The following utilization graph shows only one month of data; longer periods of data provide an
increasingly accurate picture of resource usage.
Figure 5 CPU utilization with selected percentiles of utilization
In this example, an allocation of three CPU cores is assumed, rather than the four cores initially
available in this exercise. Even this reduction may not provide the best fit, as the majority of the
work (90%) is completed with less than .5 of one core, and 99% of the work is completed with
one core.
For example, as shown in
, CPU utilization has one peak at 1.7 CPU cores,
with many lower peaks. If you configure your system to always meet the demand of this single
1.7-CPU peak, and you do not adjust the CPU allocation, a significant fraction of the CPU allocation
in this example would go unused most of the time. Depending on your quality of service goals,
you may decide that a different configuration can better use the resources available. Further
Sizing for service level objectives
19