Debugging functions – Renesas R0E530640MCU00 User Manual
Page 78

R0E530640MCU00 User’s Manual
5. Debugging Functions
REJ10J1733-0100 Rev.1.00 Apr. 01, 2008
Page 78 of 229
5. Debugging Functions
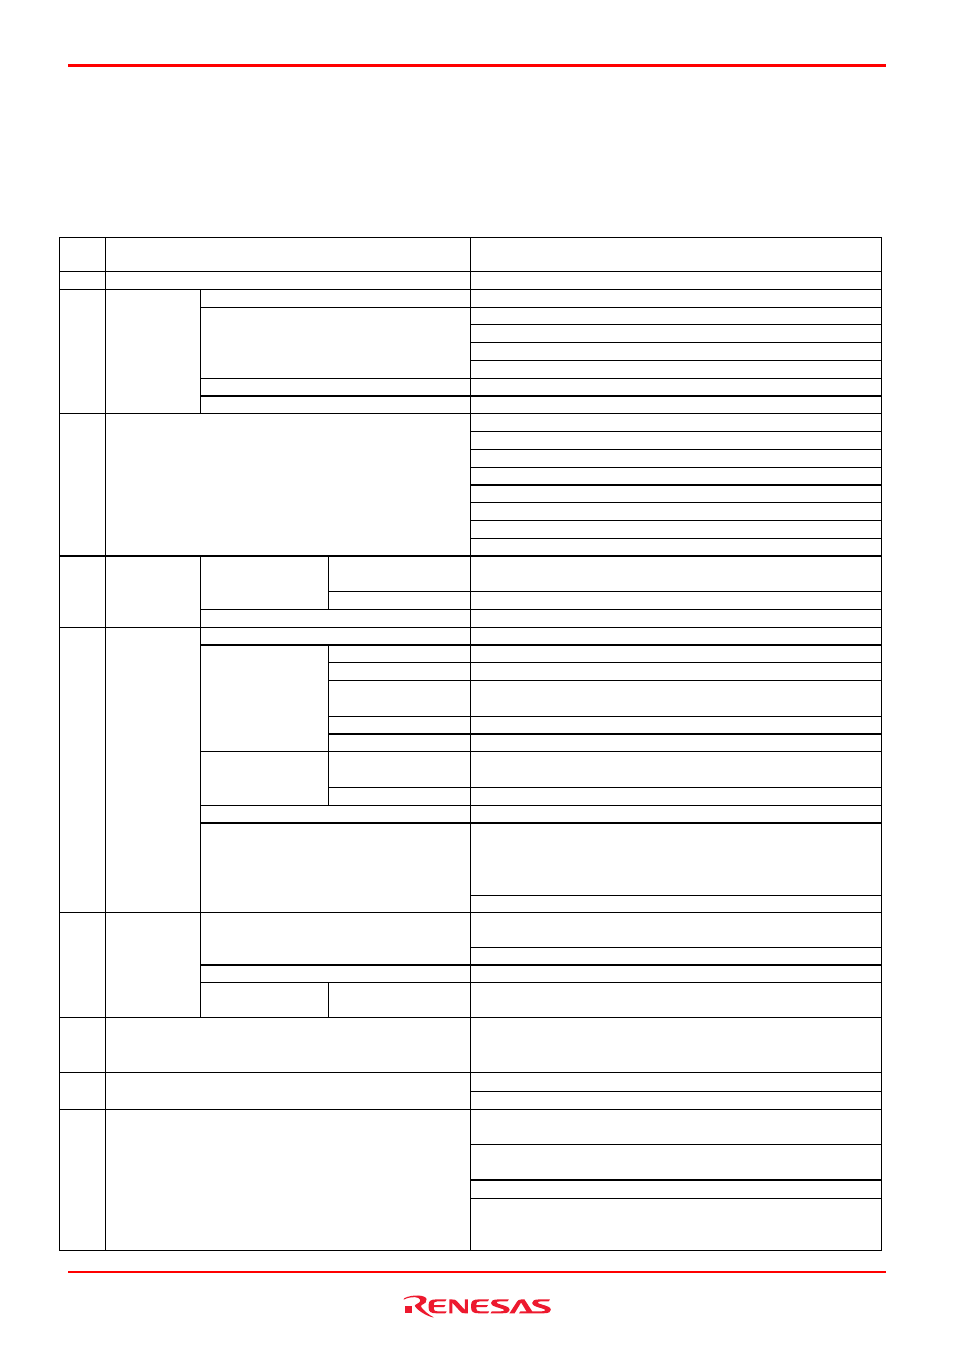
The E100 Emulator supports the functions listed in the table below.
Table 5.1 List of Debug Functions
Item
No.
Item Specification
1
Software break
4,096 points
Number of event points
Maximum number of effective points: 16
Executed address detection
Data access detection
Interrupt generation/exit detection
Content of event
External trigger detection
Task ID
Can be set separately for each event
2 Event
Number of times an event occurred
Maximum 255 times
Violation of access protection
Read from uninitialized memory
Stack access violation
Performance overflow
Realtime profile overflow
Trace memory overflow
Task stack access violation
3 Exception
detection
OS dispatch
Event combination
OR, AND (Accumulation), AND (Simultaneous), subroutine,
sequential and state transition
Hardware
breakpoints
Exception detection
See item No. 3
4
Hardware
break
Delay
Maximum 65,535 bus cycles
Trace size
Maximum 4M cycles
Fill until stop
Continues collecting until program stops running
Fill until full
Stops collecting traces when trace memory is full
Fill around TP
Stops collecting traces after retarded for delay cycles from when
trace point is reached
Repeat fill until stop
Collects a total of 512 cycles before and after trace point
Trace mode
Repeat fill until full
Collects a total of 512 cycles before and after trace point
Event combination
OR, AND (Accumulation), AND (Simultaneous), subroutine,
sequential and state transition
Trace point
Exception detection
See item No. 3
Delay
Maximum 4M bus cycles
Capture/Do not Capture by event
- Between two events
- Duration of an event
- Duration of an event occurring in a subroutine
5 Trace
Trace Capture/Do not Capture
Data access instruction extraction
Measures maximum, minimum and average execution time in up to
8 sections and pass counts
Content of measurement
Time-out and count-out detection
Resolution
10 ns to 1.6 us
6 Performance
Measurement
mode
Event combination
Between two events, Event period and Interrupt-disabled range
between two events
7 RAM
monitor
512 bytes
× 32 blocks
- Shows last read/write accesses performed
- Comes with initialization-omitted detect function
128 Kbytes
× 8 blocks (1 MB space)
8 Profile
Cumulative time and pass count overflow detection
C0 level code coverage
256 Kbytes
× 8 blocks (2 MB space)
C0+C1 level code coverage
128 Kbytes
× 8 blocks (1 MB space)
Address range and source file specification
9 Coverage
Data coverage
64 Kbytes
× 8 blocks (512 Kbytes space)
Address range, section specification and task stack
