FUJITSU ServerView Respurce Orchestrator Virtual Edition V3.1.0 User Manual
Page 171
3.
Click
After switching to the graph display window, the selected power consumption data can be displayed in line graphs.
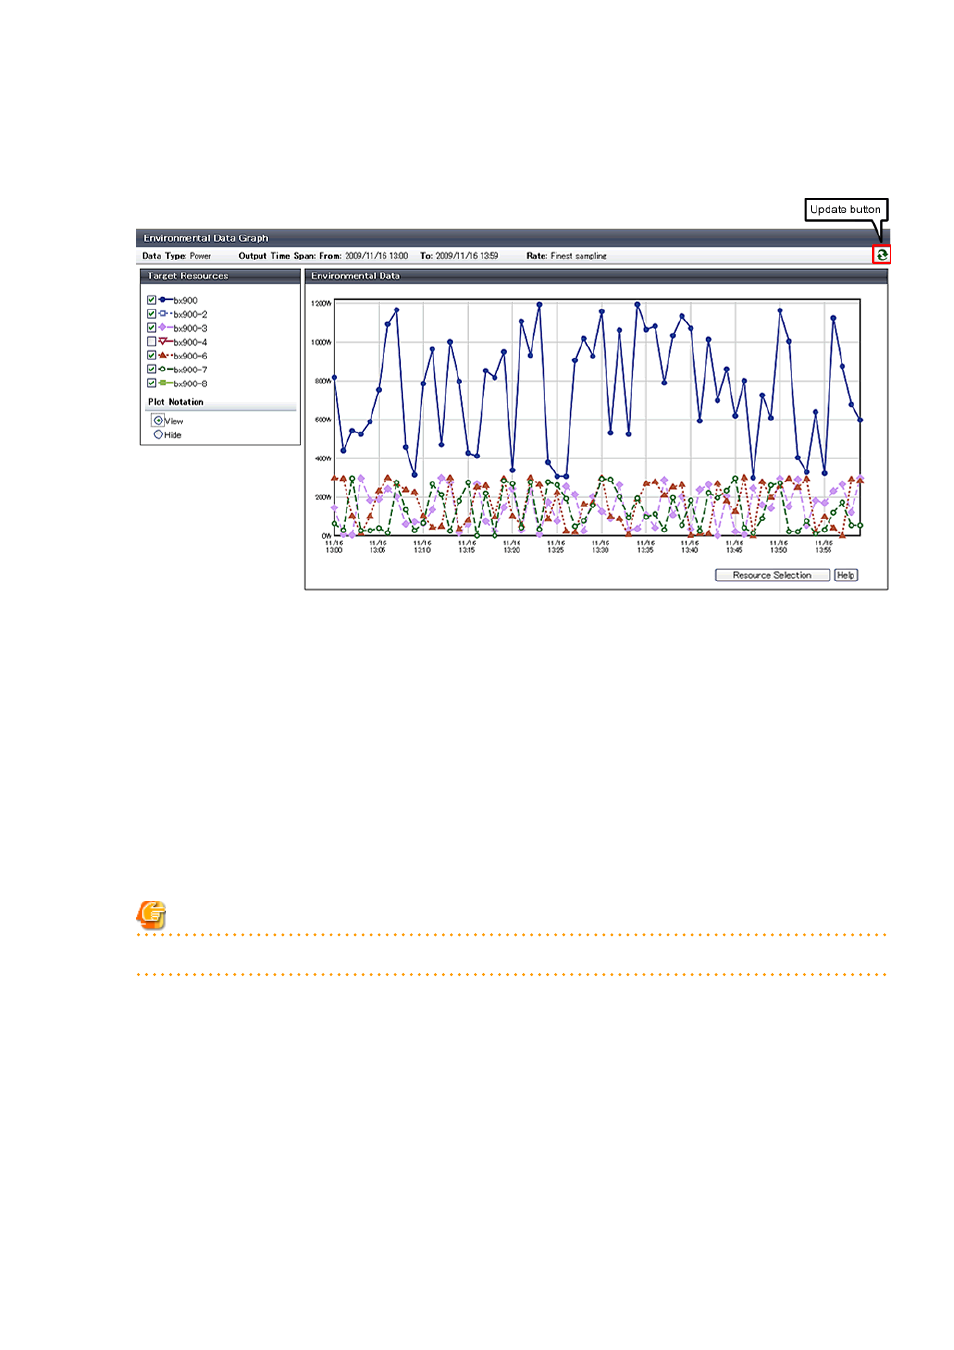
Figure 19.3 Graph Display Window
The following operations can be performed from the graph display window.
-
Switching resource display
By selecting and clearing the checkbox of the [Target Resources], it is possible to display or hide the corresponding graph.
-
Switching plot symbol display
Selecting the [View] or [Hide] radio button of [Plot Notation] switches between displaying and hiding plot symbols in line
graphs.
-
Data update
Clicking the update button on the upper right of the screen updates the displayed graph.
-
Return to resource selection window.
Clicking
Note
If you change the size of the web browser when displaying graphs, click the update button after doing so.
- 156 -
- T2000 (30 pages)
- SPARC ENTERPRISE M3000 (212 pages)
- PRIMERGY RX600 S6 (134 pages)
- BS2000 (37 pages)
- BX900 S1 (144 pages)
- BX900 S1 (142 pages)
- PRIMEQUEST 1000 Series C122-E119EN (109 pages)
- T5120 (26 pages)
- SPARC ENTERPRISE M9000 (560 pages)
- DESKPOWER 2000 (50 pages)
- SPARC M4000 (376 pages)
- PRIMERGY MX130 S2 (256 pages)
- SPARC ENTERPRISE T5120 (58 pages)
- T5240 (28 pages)
- M4000 (310 pages)
- SPARC M4000/M5000 (76 pages)
- TX150 S3 (95 pages)
- SPARC T5220 (240 pages)
- M9000 (518 pages)
- ServerView Resource Orchestrator Cloud Edition V3.1.0 (180 pages)
- PRIMERGY BX600 S2 (173 pages)
- FR family 32-bit microcontroller instruction manuel CM71-00101-5E (314 pages)
- M Server M4000 (30 pages)
- Primergy RX200 S2 (307 pages)
- DESKPOWER P301 (56 pages)
- SPARC Enterprise Server M4000 (62 pages)
- SPARC M8000 (4 pages)
- PRIMERGY B120 (68 pages)
- C120-E361-04EN (36 pages)
- R630 (76 pages)
- 2000 (66 pages)
- T1000 (84 pages)
- Server TX200 S6 (126 pages)
- PRIMERGY BX600 S3 (164 pages)
- SPARC ENTERPRISE T5220 (34 pages)
- SPARC M3000 (56 pages)
- TX300 (122 pages)
- PRIMERGY BX600 (288 pages)
- DESKPOWER 6000 (105 pages)
- SPARC Enterprise Server M3000 (8 pages)
- SPARC Enterprise Server M3000 (202 pages)
- T850 (18 pages)
- T5440 (212 pages)
- Service View Resource Orchestrator Cloud Edition V3.0.0 (102 pages)