2 displaying power consumption data graphs – FUJITSU ServerView Respurce Orchestrator Virtual Edition V3.1.0 User Manual
Page 169
Rate
Output time span
Output device count
Daily
Last year
30
Monthly
Select "Custom" and specify 5 years
60
Annual
Select "Custom" and specify 5 years
60
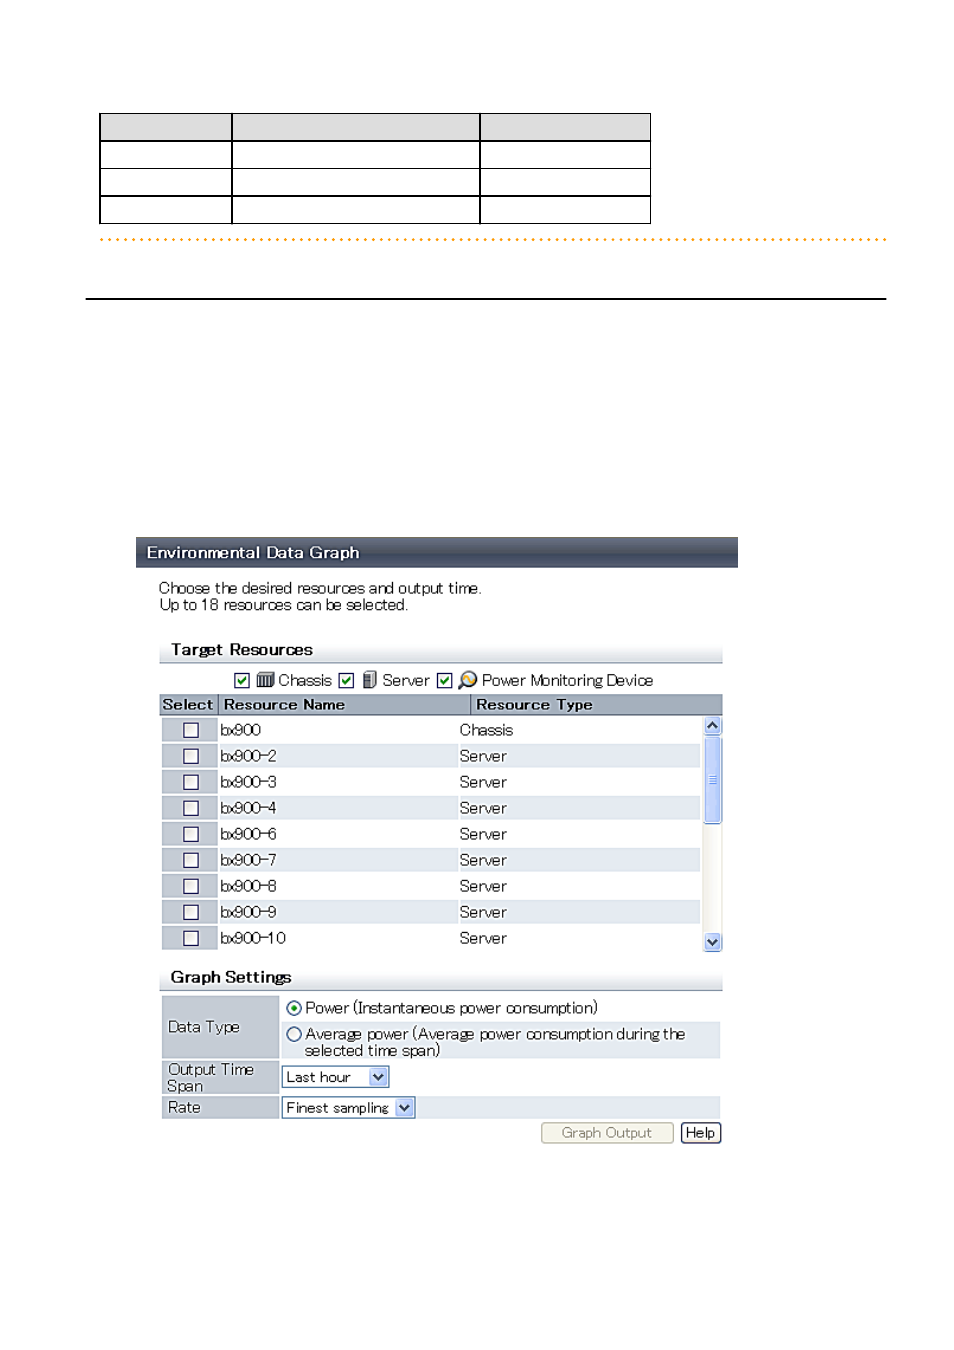
19.2 Displaying Power Consumption Data Graphs
This section explains how to display power consumption data as graphs.
The power consumption data for each power monitoring target that is registered in the power monitoring environment can be displayed
as graphs.
The collected power consumption data and average values of the specified time span and rate can be displayed in line graphs.
Use the following procedure to display power consumption data as graphs.
1.
Select [Tools]-[Environmental Data Graph] from the ROR console menu.
The [Environmental Data Graph] dialog is displayed.
2.
Set the following items:
Figure 19.2 [Environmental Data Graph] Dialog
- 154 -
- T2000 (30 pages)
- SPARC ENTERPRISE M3000 (212 pages)
- PRIMERGY RX600 S6 (134 pages)
- BS2000 (37 pages)
- BX900 S1 (144 pages)
- BX900 S1 (142 pages)
- PRIMEQUEST 1000 Series C122-E119EN (109 pages)
- T5120 (26 pages)
- SPARC ENTERPRISE M9000 (560 pages)
- DESKPOWER 2000 (50 pages)
- SPARC M4000 (376 pages)
- PRIMERGY MX130 S2 (256 pages)
- SPARC ENTERPRISE T5120 (58 pages)
- T5240 (28 pages)
- M4000 (310 pages)
- SPARC M4000/M5000 (76 pages)
- TX150 S3 (95 pages)
- SPARC T5220 (240 pages)
- M9000 (518 pages)
- ServerView Resource Orchestrator Cloud Edition V3.1.0 (180 pages)
- PRIMERGY BX600 S2 (173 pages)
- FR family 32-bit microcontroller instruction manuel CM71-00101-5E (314 pages)
- M Server M4000 (30 pages)
- Primergy RX200 S2 (307 pages)
- DESKPOWER P301 (56 pages)
- SPARC Enterprise Server M4000 (62 pages)
- SPARC M8000 (4 pages)
- PRIMERGY B120 (68 pages)
- C120-E361-04EN (36 pages)
- R630 (76 pages)
- 2000 (66 pages)
- T1000 (84 pages)
- Server TX200 S6 (126 pages)
- PRIMERGY BX600 S3 (164 pages)
- SPARC ENTERPRISE T5220 (34 pages)
- SPARC M3000 (56 pages)
- TX300 (122 pages)
- PRIMERGY BX600 (288 pages)
- DESKPOWER 6000 (105 pages)
- SPARC Enterprise Server M3000 (8 pages)
- SPARC Enterprise Server M3000 (202 pages)
- T850 (18 pages)
- T5440 (212 pages)
- Service View Resource Orchestrator Cloud Edition V3.0.0 (102 pages)