Add totals to a column design, Create a marker design – Adobe Illustrator CS4 User Manual
Page 467
460
USING ADOBE ILLUSTRATOR CS4
Graphs
8
Choose View
> Guides
> Lock Guides to remove the check mark next to Lock so you can unlock the guides. Move
the design around to make sure that the guide moves with the design.
9
Use the Selection tool
to select the whole design.
10
Choose Object > Graph
> Design.
11
Click New Design. A preview of the selected design appears.
12
Click Rename to name the design.
Add totals to a column design
1
Create the column design.
2
Select the Type tool
. Position the pointer at a point where you want the value to appear, near or in the rectangle
that defines the design.
For example, you can place the value in, above, below, to the left, or to the right of the design.
3
Click and type a percent sign (%) followed by two digits from 0 to 9. The digits control how the data is displayed.
The first digit determines how many places appear before the decimal point. For example, if your total was 122, a digit
of 3 would display 122. If you enter 0 for the first digit, the program adds the number of places necessary for the value.
The second digit determines how many places appear after the decimal point. Zeros are added as necessary, and values
are rounded up or down as necessary. You can vary these numbers, depending on how many digits you need.
4
To change the type attributes, choose Window
> Type > Character, specify the attributes you want, and close the
panel.
5
To align the decimal points, choose Window
> Type > Paragraph and click the Align Text Right button.
6
Using the Selection tool
, select the entire design, including the rectangle and any type.
7
Choose Object > Group to group the design.
8
Choose Object > Graph
> Design.
9
Click New Design. You see a preview of the selected design.
10
Click Rename to name the design.
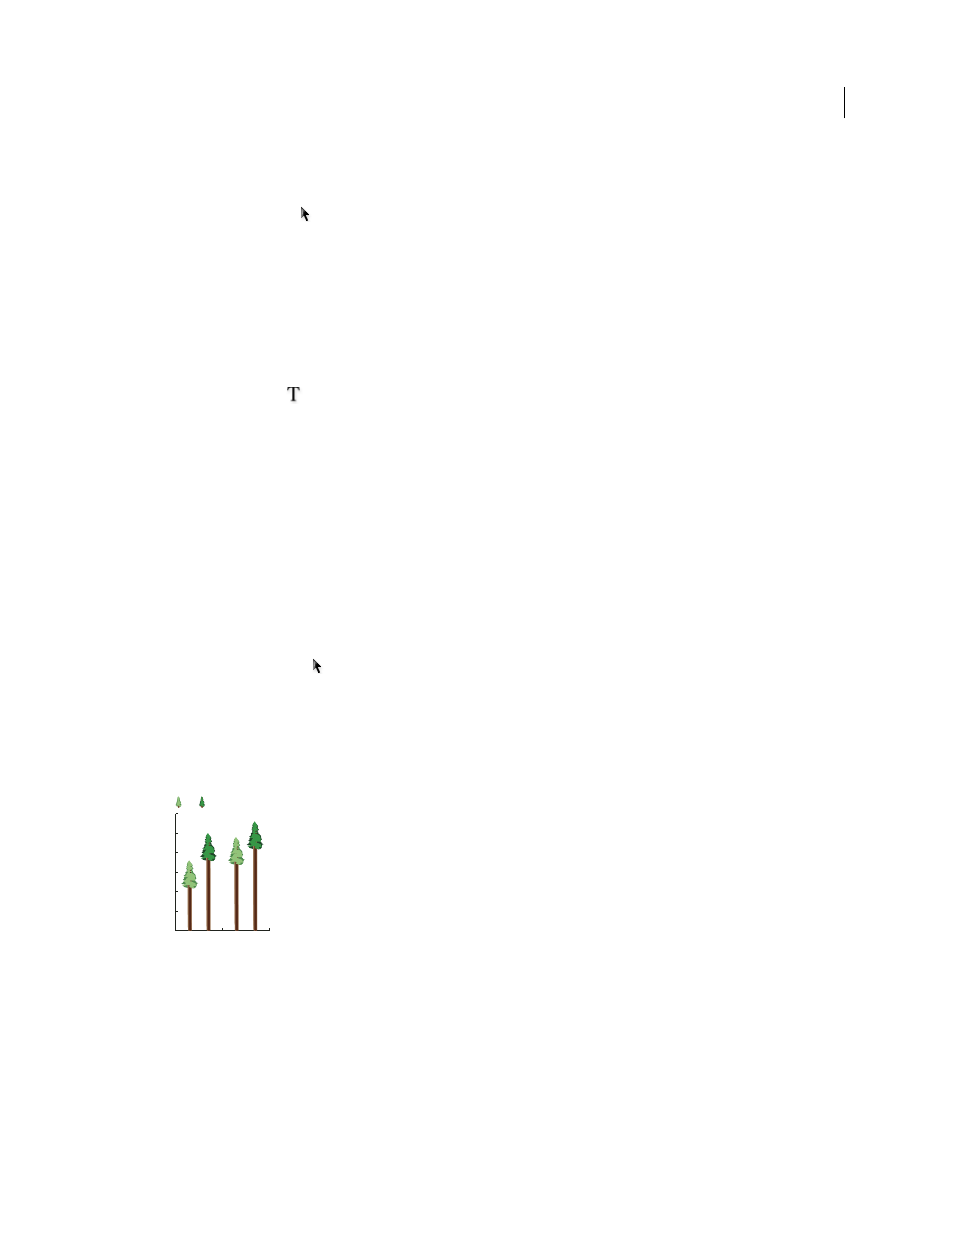
Sliding graph design with column totals
Create a marker design
1
Select and copy a marker rectangle from the graph, and paste it where you're going to create your design. This will
be the backmost object in your graph design and will establish the size of the marker.
0
50
100
150
200
250
300
250
280
180
240
B
A
2003
1993