Adding pictures and symbols to graphs, About graph designs – Adobe Illustrator CS4 User Manual
Page 465
458
USING ADOBE ILLUSTRATOR CS4
Graphs
Adding pictures and symbols to graphs
About graph designs
You use graph designs to add illustrations to columns and markers. Graph designs can be simple drawings, logos, or
other symbols representing values in a graph; they can also be complex objects that contain patterns and guide objects.
Illustrator comes with a variety of preset graph designs. In addition, you can create new graph designs and store them
in the Graph Design dialog box.
You can apply graph design to columns in several ways:
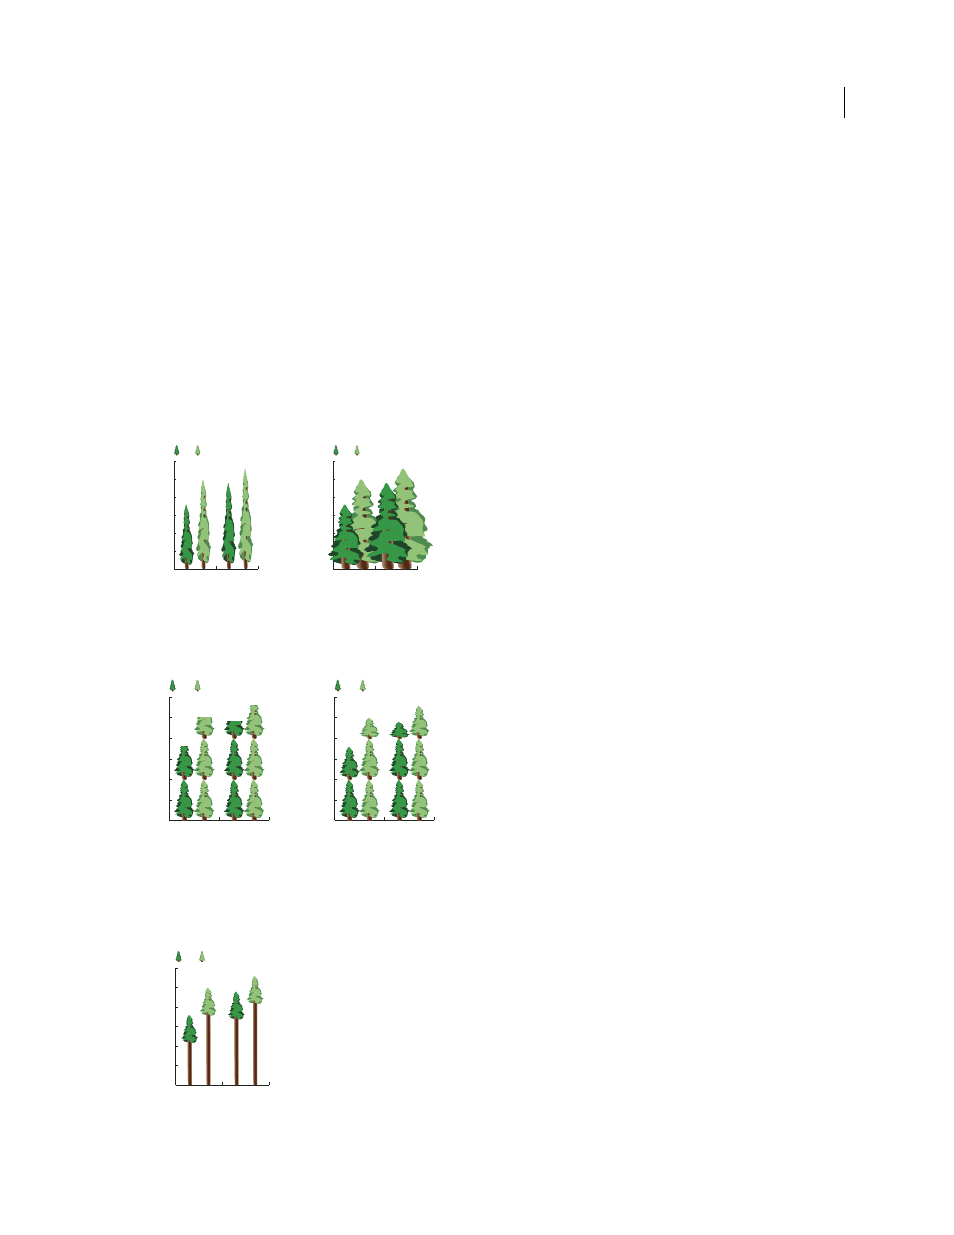
Vertically scaled design
Is stretched or compressed vertically. Its width does not change.
Uniformly scaled design
Is scaled both vertically and horizontally. The horizontal spacing of the designs is not
adjusted for the different widths.
Vertically scaled graph design compared to uniformly scaled graph design
Repeating design
Stacks a design to fill the columns. You can specify the value that each design represents, as well as
whether you want to chop or scale designs that represent fractions.
Repeating graph with chopped design compared to repeating graph with scaled design
Sliding design
Is similar to a vertically scaled design, except that you can specify where in the design to stretch or
compress it. For example, if you were using a person to represent data, you might stretch or compress only the body,
but not the head. Using the Vertically Scaled option would scale the entire person.
Sliding graph design
0
50
100
150
200
250
300
B
A
2003
1993
0
50
100
150
200
250
300
B
A
2003
1993
0
50
100
150
200
250
300
B
A
2003
1993
0
50
100
150
200
250
300
B
A
2003
1993
0
50
100
150
200
250
300
B
A
2003
1993