Markers tab, Figure 56 example, markers tab, Limits 1 tab – Bird Technologies SH-36S-RM-Manual User Manual
Page 93: Markers tab limits 1 tab
PC Tool
77
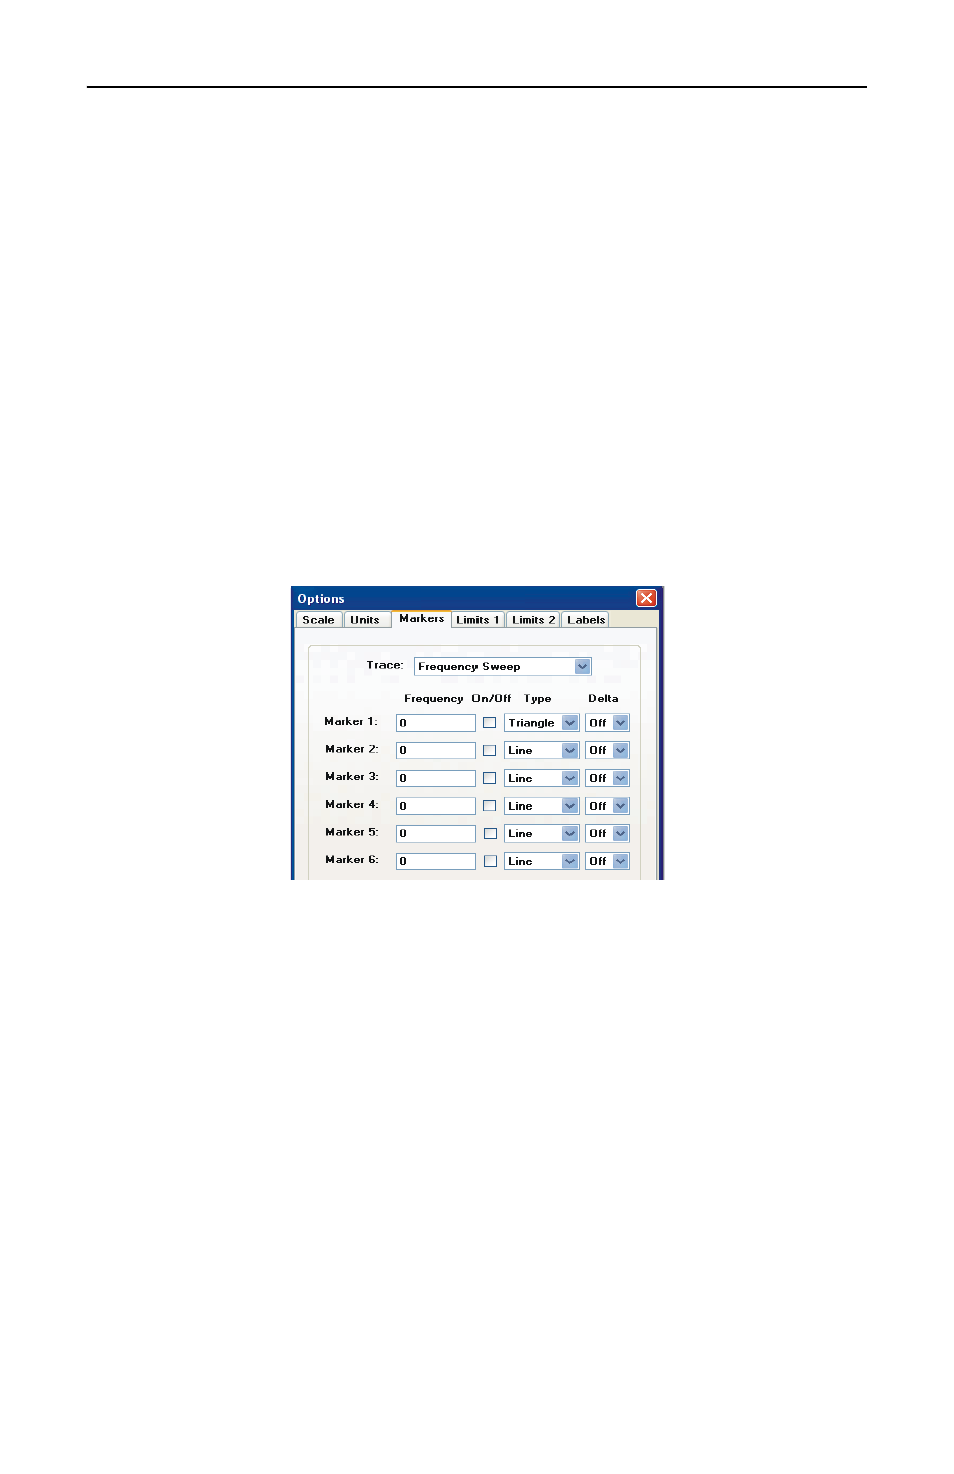
Markers Tab
When a frequency or distance for a marker is entered, the marker will
be set to the datapoint closest to that frequency or distance. The actual
frequency of the marker will replace the value entered and will also
display on the screen below the graph area.
For each marker:
1. Specify or change the frequency.
2. Specify the symbol type.
3. Specify a delta with another marker.
4. Turn a marker on or off.
Note:
After turning a marker on in the Options window,
the marker can be moved by clicking on the marker and drag-
ging it to a desired location.
Figure 56 Example, Markers Tab
Limits 1 Tab
Defines and turns on or off upper/lower limit lines.
Note:
The options displayed on this tab will change
slightly depending on the type of graph opened.
Note:
The upper limit fails any datapoints that are above
the line.
Note:
The lower limit fails any datapoints that are below
the line.
Note:
The limit line will be flat across the graph at the
power level specified.
1. Click on the line
2. Drag the line to move it up and down.
Note:
There is a drop down menu of predefined limits that
is available to be utilized.