7 graph buttons – INFICON IQM-233 Thin Film Deposition Controller PCI-Express Card Codeposition Software Operating Manual User Manual
Page 96
2 - 76
IP
N 07
4-
58
5-
P1
A
IQS-233 Operating Manual
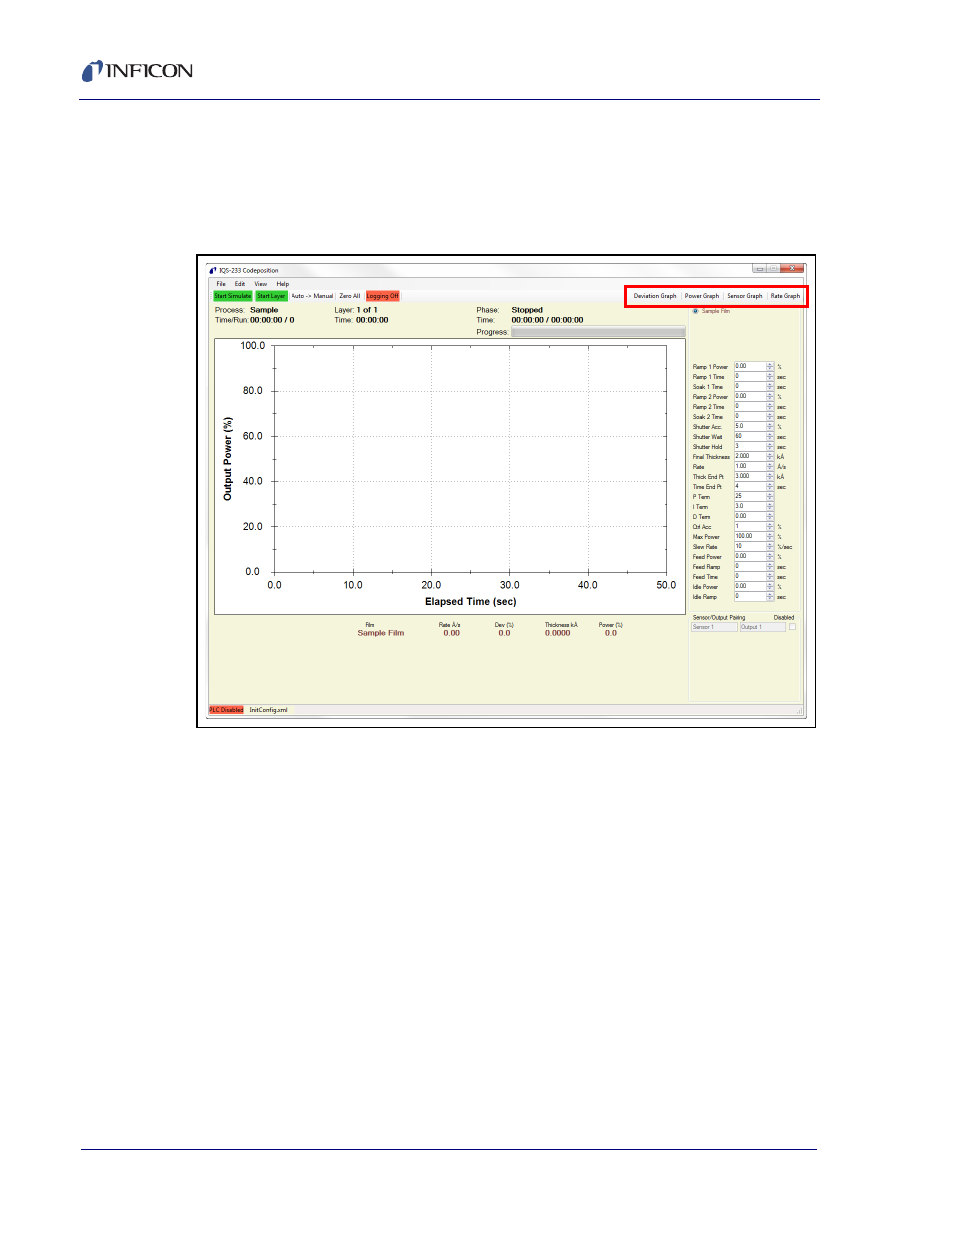
2.3.7 Graph Buttons
Click Deviation Graph, Power Graph, Sensor Graph or Rate Graph to display
the selected graph in a new window. Any combination of graphs may be displayed,
each opening in a new window. See
Figure 2-58 IQS-233 Codeposition window - graph buttons
NOTE: To zoom in the graph, click in the graph window and drag to draw a box
over the data needing to be enlarged. To further zoom in, or to zoom out,
rotate the wheel button up or down, respectively, with the pointer in the
graph window.
Deviation Graph, see
Power Graph, see
Sensor Graph, see
Rate Graph, see
See also other documents in the category INFICON Equipment:
- TGF10 Tracer Gas Filler (36 pages)
- Sensistor ILS500 F Leak Detection Filler (90 pages)
- T-Guard Leak Detection Sensor (85 pages)
- T-Guard Leak Detection Sensor Interface description (40 pages)
- Sensistor ISH2000P Hydrogen Leak Detector, Panel Model (51 pages)
- Sensistor ISH2000 HySpeed Hydrogen Leak Detector (54 pages)
- LDS3000 Modular Leak Detector (52 pages)
- LDS3000 Modular Leak Detector Interface description (56 pages)
- BM1000 Bus module (14 pages)
- I/O1000 I/O module (18 pages)
- CU1000 Control unit (24 pages)
- Helium Leak Detector Modul1000 (130 pages)
- Helium Leak Detector Modul1000 Interface description (40 pages)
- UL5000 Dry Helium Leak Detector (108 pages)
- UL5000 Dry Helium Leak Detector Interface description (14 pages)
- UL1000 Fab Dry Helium Leak Detector (119 pages)
- HLD6000 Refrigerant Leak Detector (76 pages)
- HLD6000 Refrigerant Leak Detector Interface Description (40 pages)
- IO1000 I/O module (18 pages)
- Ecotec E3000 Multigas-Sniffer-Leak Detector (92 pages)
- Ecotec E3000 Multigas-Sniffer-Leak Detector Interface description (36 pages)
- Sensistor XRS9012 Hydrogen Leak Detector User Manual (28 pages)
- Sensistor XRS9012 Hydrogen Leak Detector Maintenance manual (14 pages)
- Extrima Ex-certified Hydrogen Leak Detector (62 pages)
- Sensistor ILS500 Leak Detection System (107 pages)
- Sensistor ISH2000 Hydrogen Leak Detector (58 pages)
- Sensistor ISH2000 Hydrogen Leak Detector (108 pages)
- Sensistor Sentrac Hydrogen Leak Detector (86 pages)
- Protec P3000(XL) Helium Leak Detector (132 pages)
- Pilot Plus Vacuum Gauge (2 pages)
- CO Check Carbon Monoxide Meter (2 pages)
- GAS-Mate Combustible Gas Leak Detector (12 pages)
- Whisper Ultrasonic Leak Detector (8 pages)
- Vortex AC Refrigerant Recovery Machine 115V (20 pages)
- Vortex AC Refrigerant Recovery Machine 230V (16 pages)
- Wey-TEK Refrigerant Charging Scale & Optional Charging Module (2 pages)
- Wey-TEK Refrigerant Charging Scale & Optional Charging Module (44 pages)
- D-TEK CO2 Refrigerant Leak Detector (12 pages)
- TEK-Mate Refrigerant Leak Detector (12 pages)
- Compass Refrigerant Leak Detector (12 pages)
- D-TEK Select Refrigerant Leak Detector (12 pages)
- Explorer Portable Gas Chromatograph (369 pages)
- MicroFID II Portable Flame Ionization Detector (89 pages)
- DataFID Portable Flame Ionization Detector for Landfill Emissions Monitoring (91 pages)
- Hydrostik Hydrogen Fuel Cylinder Installation (7 pages)