Apple Keynote 1 User Manual
Page 72
Creating Charts
71
You can separate any or all of the pie wedges.
To separate pie wedges for shadowing:
1
Select the chart or individual pie wedges.
2
Choose Individual from the Shadow pop-up menu in the Series pane of the Chart Inspector.
Layering the wedges for shadowing puts shadows on all of the pie wedges, rather than the
entire pie as a whole. It also allows you to apply opacity to individually selected wedges. If
you select Group from the pop-up menu, you can apply shadows or opacity to the pie as a
whole in the Graphic Inspector. To change shadow and opacity attributes, see “Adding
Shadows” on page 51 and “Adjusting Opacity” on page 52.
Bar and Column Charts
Data series elements in bar and column charts can also be layered for shadowing. However,
in these chart types, you must layer all the elements in all of the data series, or none at all.
You can also adjust the spacing between data sets or individual bars.
To layer bars for shadowing:
1
Select the chart.
2
Choose Individual from the Shadow pop-up menu in the Series pane of the Chart Inspector.
Layering the bars for shadowing lets you add shadows to each of the individual bars in the
chart. If you select Group from the pop-up menu, you can apply shadows to the chart as a
whole in the Graphic Inspector. To read more about the Graphic Inspector and changing
shadow attributes, see “Adding Shadows” on page 51.
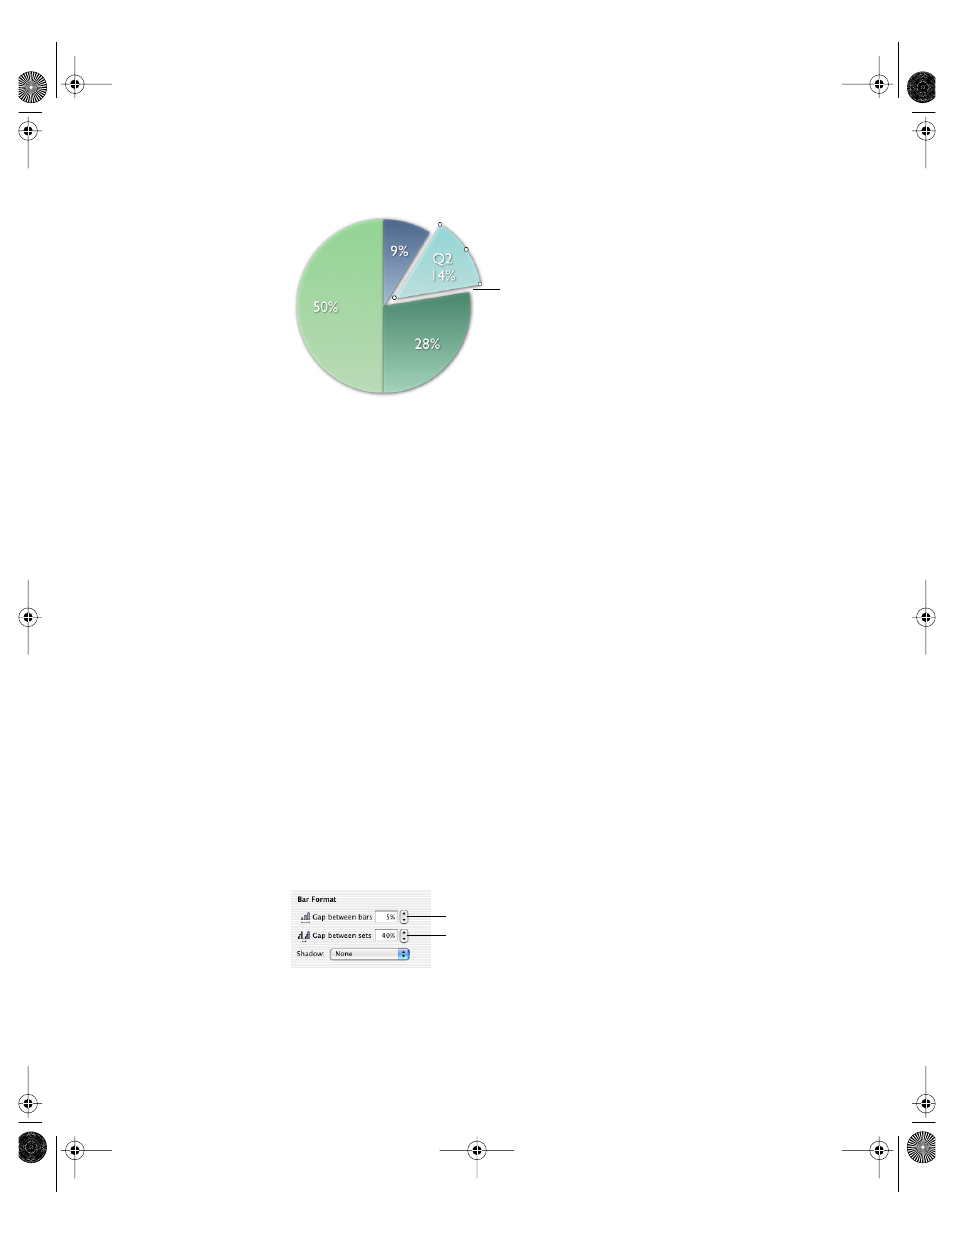
Set a pie wedge apart by using the
“Explode wedge” slider and giving
it a series label.
Separate the individual bars in the chart.
Separate the data sets in the chart.
LL2168CH Page 71 Tuesday, November 26, 2002 8:54 AM