Apple Keynote 1 User Manual
Page 71
70
Chapter 6
m
Press Command-A to select all the wedges.
To show pie chart values as percentages of the whole:
1
Select the chart, then select the “Show value” checkbox in the Series pane of the Chart
Inspector.
2
Select the checkbox labeled “Show pie values as percentages.”
Use the Series tab of the Chart Inspector to show or hide pie chart series labels. You can also
choose to display the data point values as percentages of the total or as absolute values.
To place series labels in pie charts:
1
Select the chart or individual pie wedges in the chart.
2
Select the “Show series name” checkbox in the Series pane of the Chart Inspector.
3
Choose Inside or Outside from the Position pop-up menu.
Choosing Outside places the label outside the selected wedges and the pie chart. Choosing
Inside places the label directly on top of the selected pie wedges. You can choose to place
the label outside small wedges and inside large ones. If a pie wedge is not selected when you
select the “Show series label” checkbox, it will not be labeled.
To separate individual pie wedges:
1
Select the chart or individual pie wedges. (To select more than one pie wedge, hold down
the Command key as you select each wedge.)
2
Drag the “Explode wedge” slider until the pie wedges are separated as far as you want, or
drag the pie wedges.
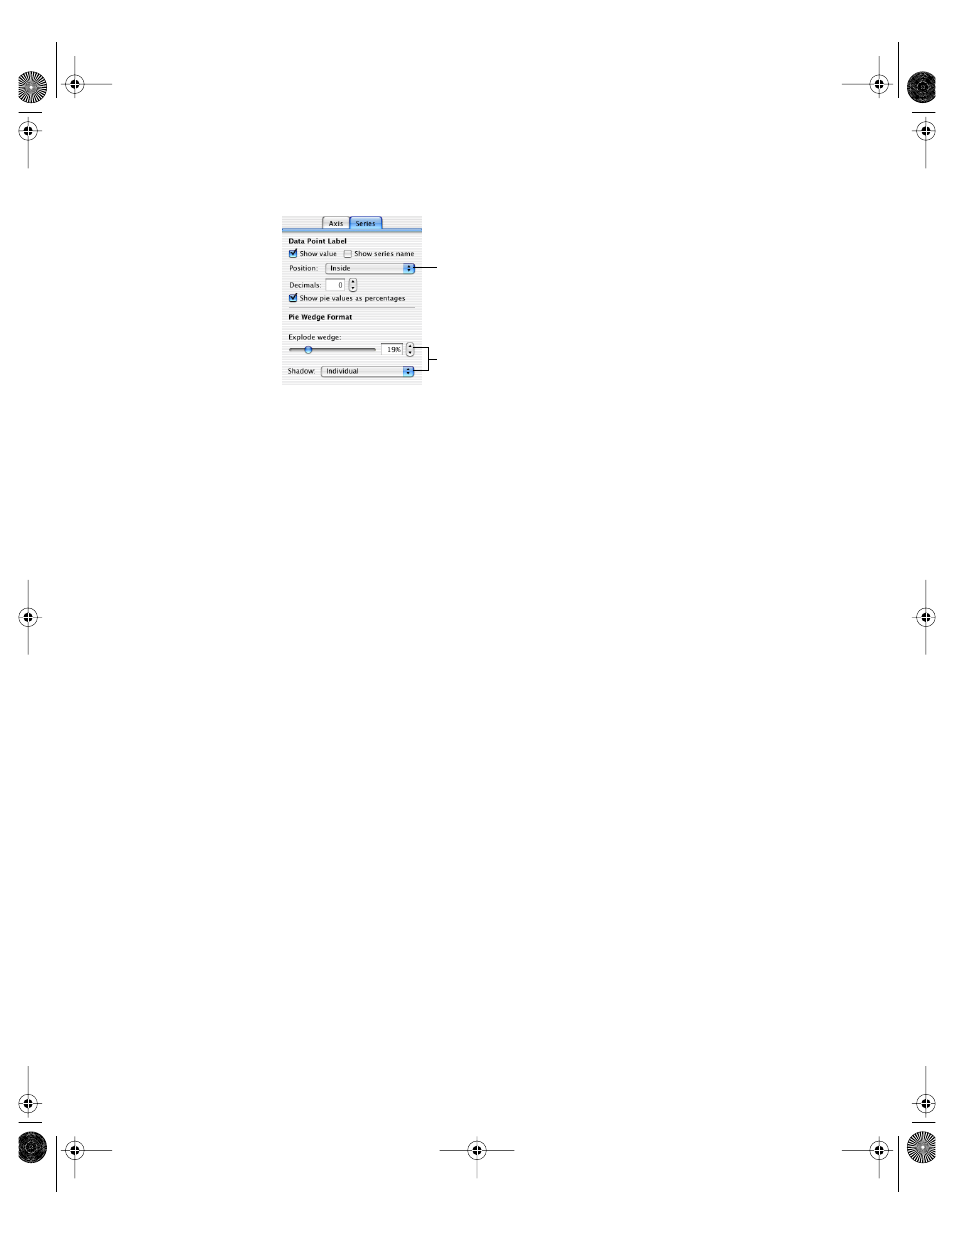
Separate and add shadows
to individual wedges.
For pie charts, place the data point
values and series label inside or
outside the selected pie wedge.
Display as percentages or numbers.
LL2168CH Page 70 Tuesday, November 26, 2002 8:54 AM