Displaying the usage monitor graph, Starting and stopping usage monitoring, 71 usage monitor window – HP StorageWorks XP Remote Web Console Software User Manual
Page 172

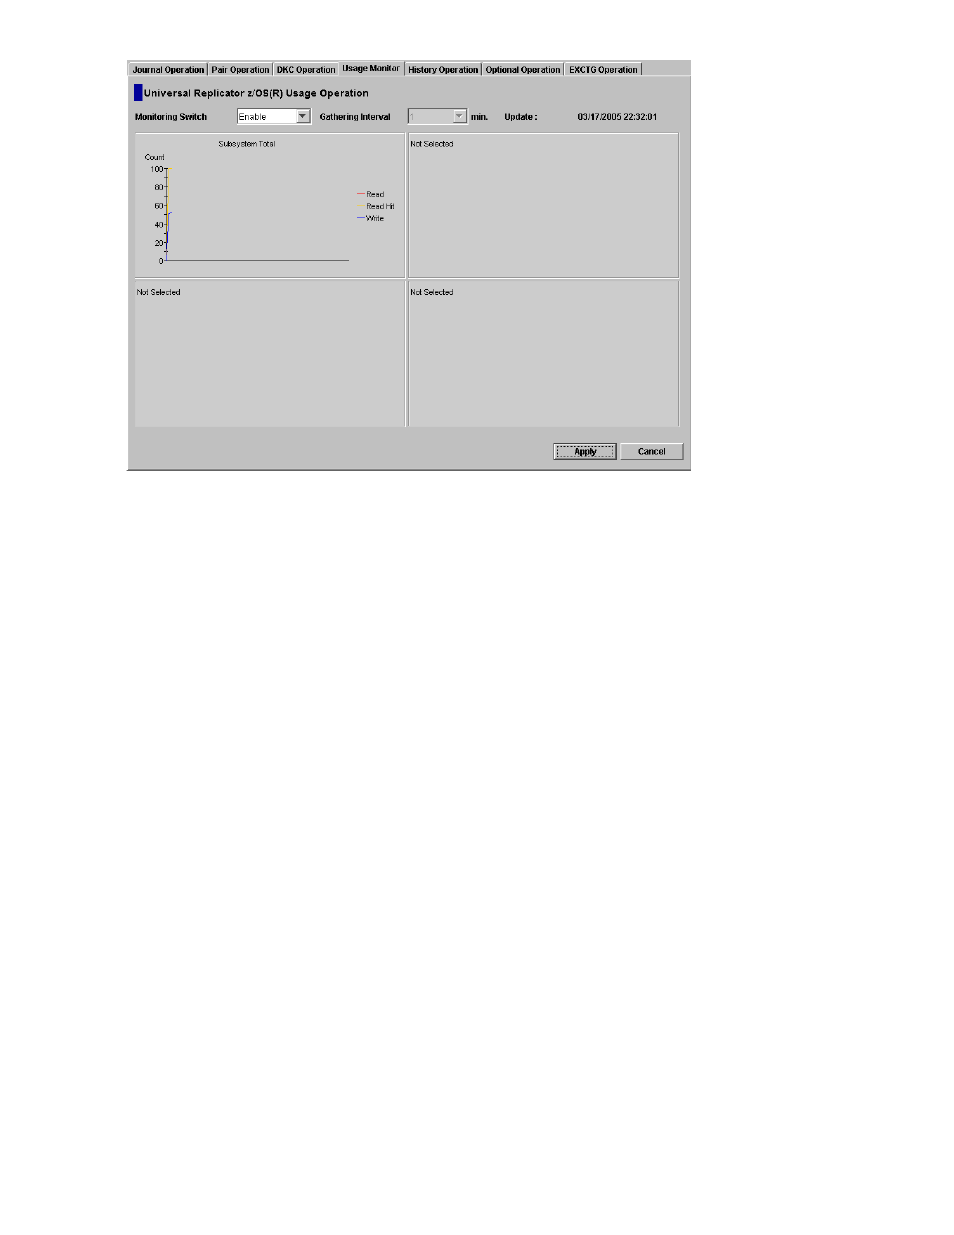
Figure 71 Usage Monitor Window
•
Monitoring Switch: displays Enable when monitoring is on; displays Disable when monitoring is
off. When monitoring is stopped, the usage monitor graph is closed.
Gathering Interval: displays the data collection interval
Update: displays the most recent data sample time of the data on the graph.
•
Graph: displays the remote I/O statistic information and the status of remote copy monitor.
Starting and Stopping Usage Monitoring
Starting and stopping usage monitoring can be set using Performance Monitor. For detail about starting
and stopping usage monitoring, please refer to Performance Monitor User’s Guide.
Displaying the Usage Monitor Graph
When usage monitoring is running, the Usage Monitor window can display user-selected remote copy
I/O statistics in real time.
The usage monitor graph plots the user-selected I/O statistics (up to 65 data points) on an x-y graph. The
x-axis displays time. The y-axis displays the number of I/Os during the last sampling period. The legend
(right side of the graph) indicates the data being displayed. A value on the y-axis varies according
to the maximum value of the statistical data that is displaying. If the value on the y-axis exceeds
10,000,000, the value is displayed in exponential notation (e.g., 1E7 = 1×10
7
= 10,000,000; 2E8
= 2×10
8
= 200,000,000).
To display the usage monitor graph:
1.
Make sure that usage monitoring is running (Monitoring Switch = Enable). The usage monitor
graph can only be displayed when monitoring is on.
2.
Right-click the graph area of the Usage Monitor window, and select Display Item to open the
Display Item window (see
3.
Select an appropriate radio button in Select Volume, following the instructions below:
172
Monitoring Remote Copy Operations
