Techne PrimeQ User Manual
Page 159
159
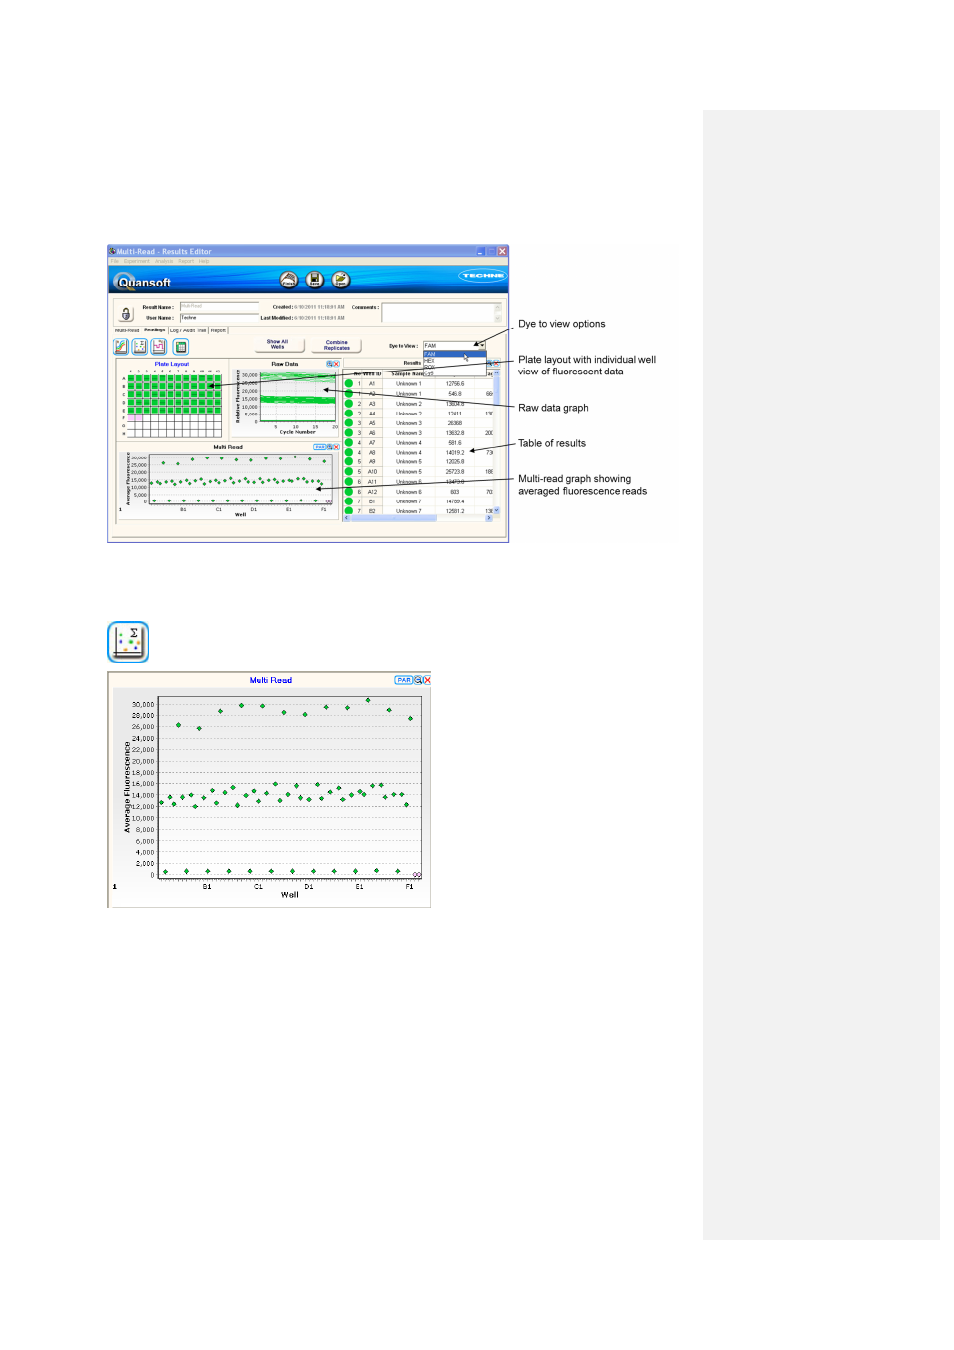
When the run has completed, results can be viewed in the Results Editor with data from each
stage of the run located under its own tab.
Multi-read graph
The graph displays the average readings for each well as colour-coded points.
If the multi-read graph is not displayed, simply click on the Multi-read icon to bring up the data:
• Clicking a well(s) in the plate layout will highlight the selected well on the multi-read graph.
Results table
The data is displayed with the sample/well ID and an average of the selected readings in each
well. This value is plotted on the multi-read graph.