Techne PrimeQ User Manual
Page 127
127
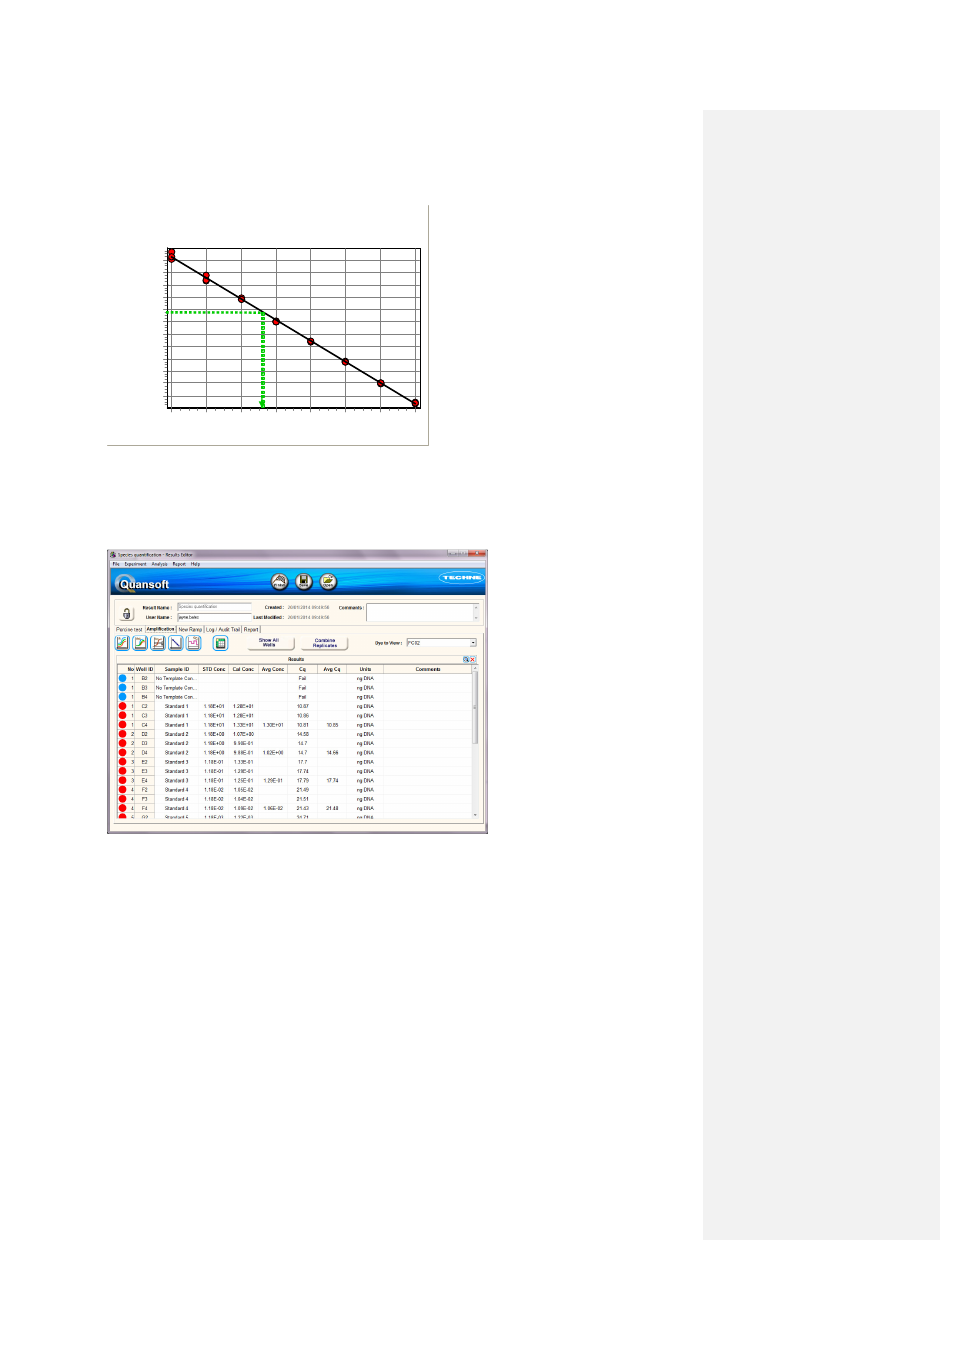
3.14.6.4 Results table
Concentrations are calculated for the unknowns based on a comparison of Cqs with standards of
known concentration. The results are displayed in the results table.
Column headings:
• No: Well number.
• Well ID: Location of well.
• Sample ID: User-supplied or default name of well.
• STD Conc: Concentration of standard (not shown if < 2 standards in plate layout).
• Cal Conc: Calculated concentration of sample.
• Avg Conc: Mean concentration obtained for all replicates of a sample
• Cq: Quantification cycle for sample.
• Avg Cq: Mean Cq obtained for all replicates of a sample.
• Units: Unit of concentration.
• Comments: User inputted text.
y = -3.402x + 43.278
R² = 0.999 E = 1.967
Log Conce ntration
9
8
7
6
5
4
3
2
C
y
c
le
N
u
m
b
e
r
36
34
32
30
28
26
24
22
20
18
16
14
y = -3.402x + 43.278
R² = 0.999 E = 1.967
Log Conce ntration
9
8
7
6
5
4
3
2
C
y
c
le
N
u
m
b
e
r
36
34
32
30
28
26
24
22
20
18
16
14
y = -3.402x + 43.278
R² = 0.999 E = 1.967
Log Conce ntration
9
8
7
6
5
4
3
2
C
y
c
le
N
u
m
b
e
r
36
34
32
30
28
26
24
22
20
18
16
14
y = -3.402x + 43.278
R² = 0.999 E = 1.967
Log Conce ntration
9
8
7
6
5
4
3
2
C
y
c
le
N
u
m
b
e
r
36
34
32
30
28
26
24
22
20
18
16
14