Techne PrimeQ User Manual
Page 124
124
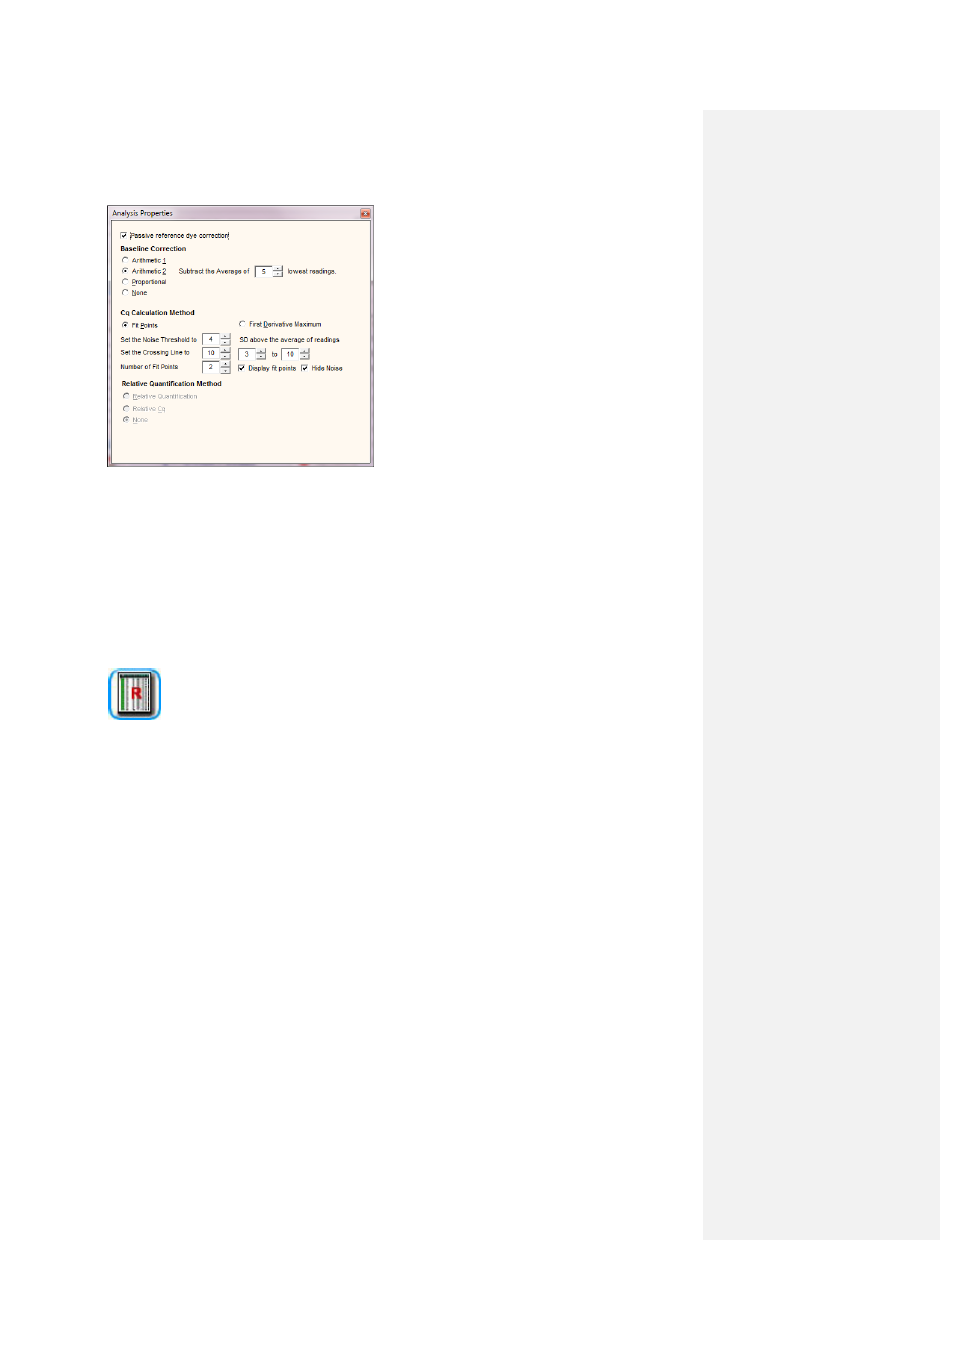
Changes to the analysis parameters can also be made via the
Analysis Selection box on the
main page of the Results Editor.
If a PRD was assigned in the dye usage box, then the PRD correction options can be accessed by
clicking the
PAR icon next to the raw data graph.
• Click the raw data graph icon if the raw data graph is not displayed.
3.14.4
PrimeQ Report
The report options can be changed from within the report tab of the Results Editor. Click on the
report options icon, which will bring up the Report Options box. Tabs will display the report options
relevant for each stage. Change as appropriate and click
Done to finish.
3.14.5
Using Cq values
Cq values can be used in a number of different ways:
• Plot the Cqs of standards against log concentration to produce a standard curve –
concentration of unknowns can be read off using their Cq.
• Compare Cq values from well-to-well.
• Compare the Cqs from two different reporters in the same well.
• Compare the concentration of the two different reporters in the same well.
3.14.6
Comparing Cq values using a standard curve
If there are defined standards in the plate layout, the Cq for each can be plotted against the log of
its concentration to produce a standard curve. The concentration of an unknown can then be
extrapolated from the graph on the basis of its Cq.