Techne PrimeQ User Manual
Page 147
147
Clicking an individual well or a selection of wells in the plate layout will highlight just the selected
well(s) on the plus-minus graph. Clicking the Show all wells button will re-select all wells.
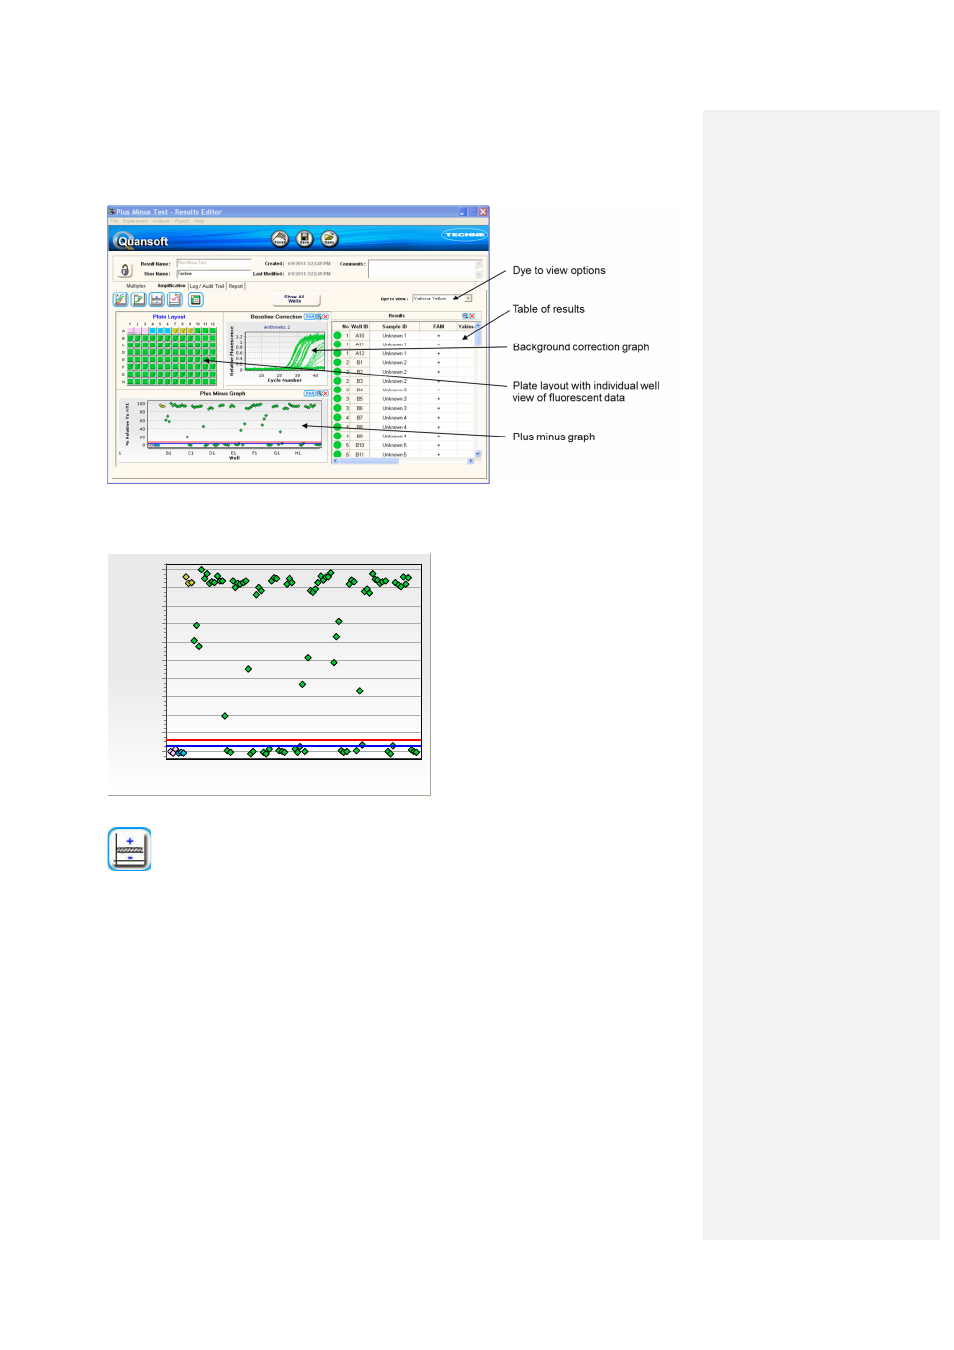
The plus-minus graph
If the plus-minus graph is not displayed, click on the icon to bring up the data:
The plus-minus graph displays the values as points and the confidence threshold as sliding
cursors (blue is the lower threshold and red, the upper). The user is able to drag either threshold
using the mouse thereby including or rejecting individual samples.
Results table
Each sample is categorized in the results table as positive, negative or undetermined for each
reporter based on:
(+) Positive: sample value > upper threshold.
(-) Negative: sample value < lower threshold.
(?) Undetermined: sample value is between lower and upper thresholds.
A
Score is given if one of the dyes is designated an IPC. In the example below, the FAM™
reactions are designated IPCs and should appear positive in each well unless there is a fault with
the PCR e.g. inhibitor present.
Well
%
R
e
la
ti
v
e
T
o
N
T
C
100
90
80
70
60
50
40
30
20
10
0