Techne PrimeQ User Manual
Page 131
131
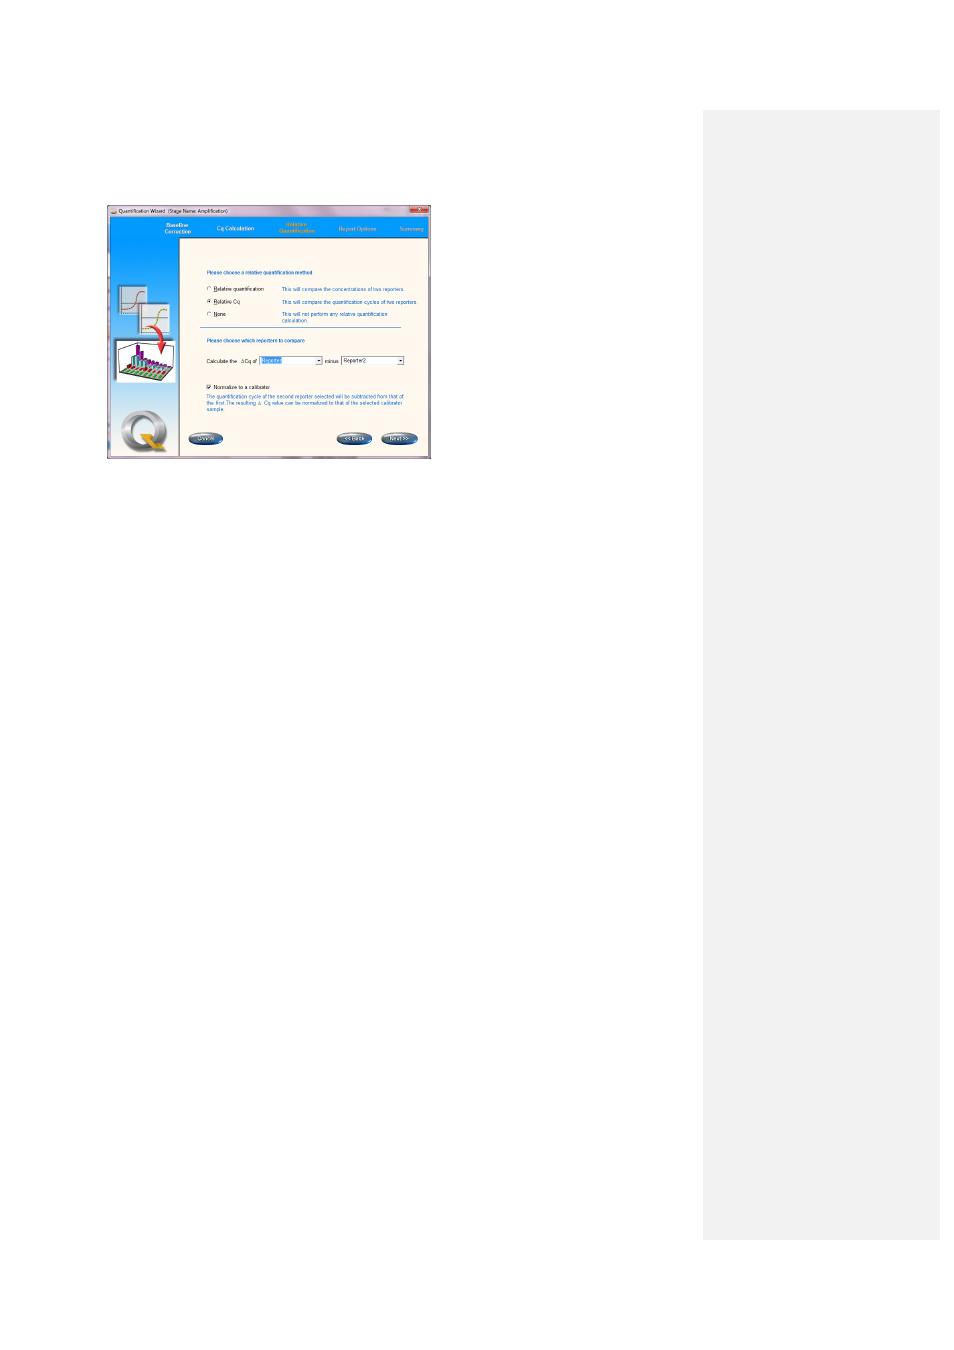
Choosing
Relative Cq in the Relative
Quantification window brings up the
settings box.
The user can select which reporters to compare using the drop-down box shown above. The first
is usually the gene of interest and the second the REF gene amplified from the same sample. The
Cq of the second reporter selected will be subtracted from that of the first and the resulting ∆Cq
value can then be compared to that of a calibrator (if a reference sample has been defined as a
calibrator,
CAL, in the plate layout). The calculation, which is performed by the software, can be
summarized as follows:
• Calculate Cq for each sample (using either fit points or first derivative maximum).
• Calculate the ∆Cq for each sample e.g. ∆Cq = Cq reporter – Cq REF.
• If a calibrator sample is present, then assign this sample as a CAL sample type in the plate
layout.
• Calculate ∆∆Cq: ∆∆Cq = ∆Cq sample – ∆Cq calibrator.
• Calculate 2
-∆∆Cq
This value represents the amount of target normalized to a control gene (REF) and relative to a
calibrator (CAL) sample. If this number is more than 1, it represents a fold increase in expression
over the calibrator which in theory has no upper limit. However, the user must be aware that a
decrease can only be represented by a value between 0 and 1 such that a seemingly small
decrease may in fact represent a significant decrease in expression relative to the calibrator.
The same principle applies for the report options as for relative quantification. The results table
shows the Cq calculations.
3.14.7.4 Viewing comparative Cq results
The Results Editor will display the comparative Cq data consisting of the plate layout and the
amplification curves for both reporters.