Techne PrimeQ User Manual
Page 139
139
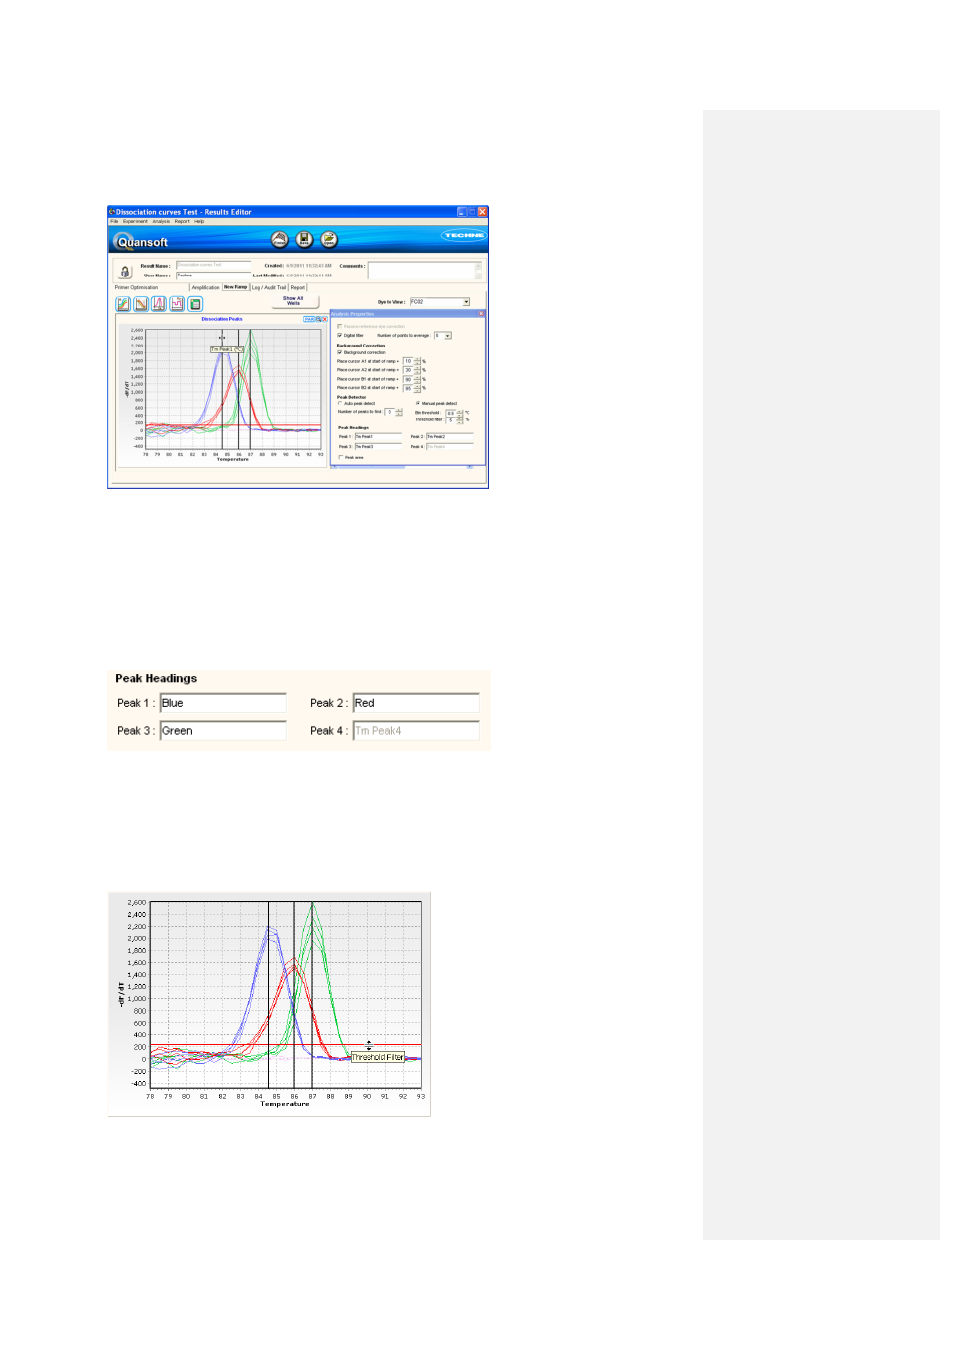
Peak Headings
Each peak cursor can be individually named by typing a name in the appropriate Peak Headings
box.
• Click on the PAR button to view the Peak Headings box.
• Type in a name for the peak.
The new name will then appear in the Results Table column heading and in the Report. This may
facilitate identification of peaks corresponding to different PCR products.
Threshold filter
The Threshold filter appears as a red horizontal sliding cursor across the dissociation peaks graph
at the default setting of 5%. This parameter limits the size of the peaks detected – peaks smaller
than the specified threshold % relative to the tallest peak are not recorded. For example, if a well’s
largest peak has a height of 1000 on the dissociation peak graph (-dF/dT vs. temp) and the
threshold is set to 5%, any peaks with a height of less than 50 are assumed to be noise and
ignored.
The cursor can be moved manually to
increase or decrease the threshold value
for peaks detected. The new cursor
position will be updated in the
PAR box.
In a small number of cases, a Tm for a
peak may appear in the Results Table
even when the cursor is placed just
above peak. This is due to the
mathematical curve fitting algorithm used
to calculate the Tm. The peak can be
excluded by raising the cursor slightly
higher.