3 compensation – Yokogawa Integral Oxygen Analyzer ZR202 User Manual
Page 111
IM 11M13A01-04E
9-3
9. Calibration
9.1.3
Compensation
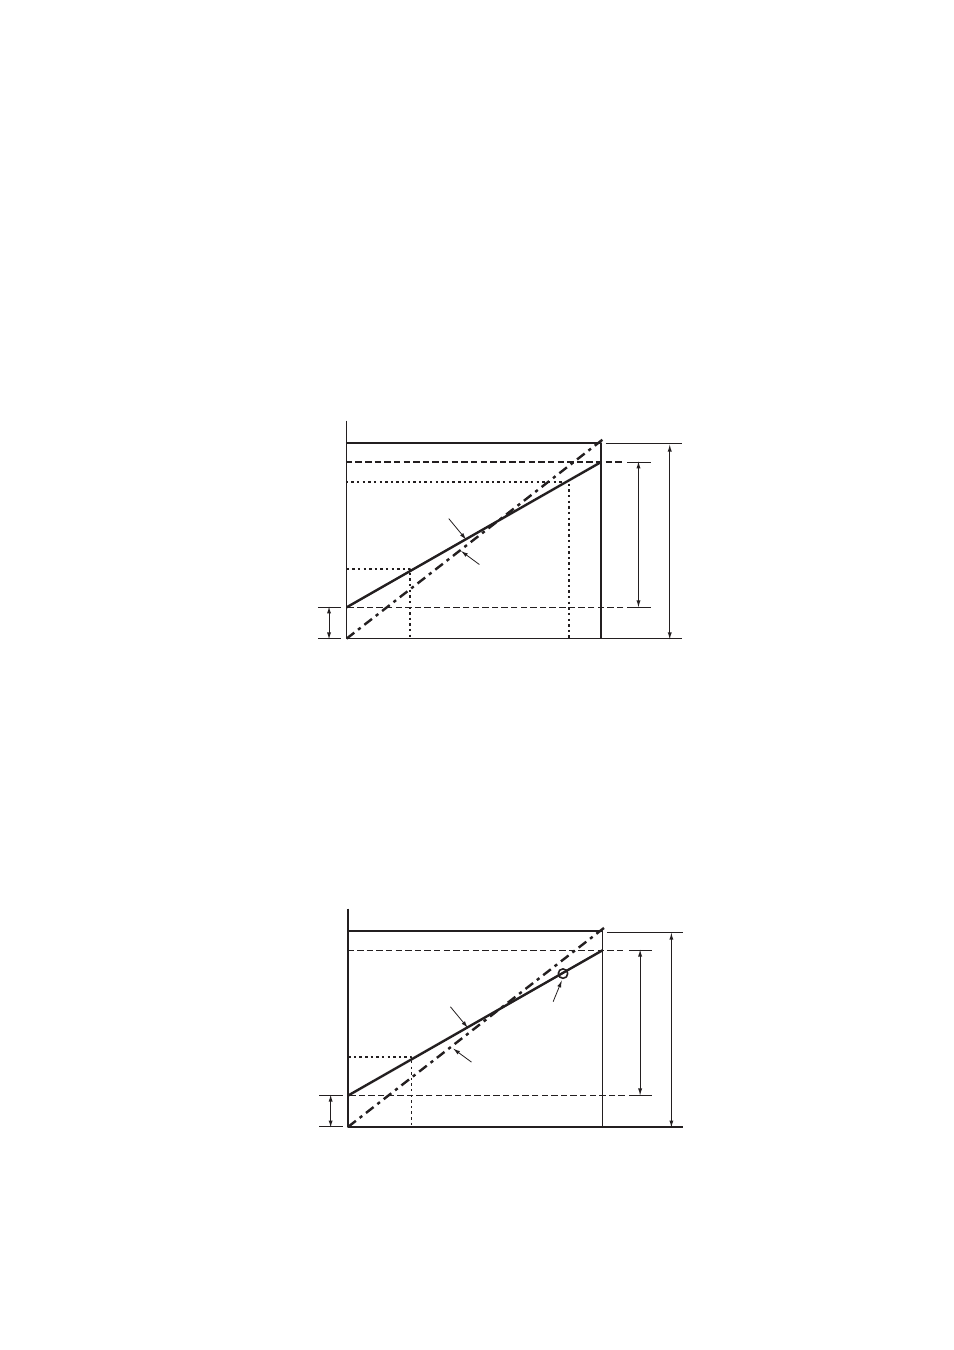
The deviation of a measured value from the theoretical cell electromotive force is
checked by the method in Figure 9.2 or 9.3.
Figure 9.2 shows a two-point calibration using two gases: zero and span. Cell electromo-
tive forces for a span gas with an oxygen concentration p1 and a zero gas with an
oxygen concentration p2 are measured while determining the calibration curve passing
between these two points. The oxygen concentration of the measurement gas is deter-
mined from this calibration curve. In addition, the calibration curve corrected by
calibration is compared with the theoretical calibration curve for determining the zero-
point correction ratio represented by B/A
ϫ 100 (%) on the basis of A, B and C shown
in Figure 9.2 and a span correction ratio of C/A
ϫ 100 (%). If the zero-point correction
ratio exceeds the range of 100
Ϯ 30 % or the span correction ratio becomes larger than
0
Ϯ 18 %, calibration of the sensor becomes impossible.
21.0
p1
p2
0.51
81.92
ez
e2
e1
es
0
C
A
B
Zero-point correction factor = (B/A) x 100 (%) Correctable range: 100
±
30%
Span correction factor = (C/A) x 100 (%) Correctable range: 0
±
18%
Cell
electromotive
force, mV
Calibration curve
before correction
Corrected calibration
curve (theoretical
calibration curve)
Zero origin
Span-gas concentration
Zero-gas concentration
Span origin
Oxygen concentration (vol% O
2
)
F9.2E.EPS
Figure 9.2 Calculation of a Two-point Calibration Curve and Correction
Factors using Zero and Span Gases
Figure 9.3 shows a one-point calibration using only a span gas. In this case, only the cell
electromotive force for a span gas with oxygen concentration p1 is measured. The cell
electromotive force for the zero gas is carried over from a previous measurement to
obtain the calibration curve. The principle of calibration using only a span gas also
applies to the one-point calibration method using a zero gas only.
21.0
p1
0.51
81.92
ez
e1
es
0
C
A
B
Zero-point correction factor = (B/A) x 100 (%) Correctable range: 100
±
30%
Span correction factor = (C/A) x 100 (%) Correctable range: 0
±
18%
Cell
electromotive
force, mV
Calibration curve before
correction
Previous
zero-gas data
Corrected calibration curve
(theoretical calibration curve)
Zero origin
Span origin
Span-gas concentration
Oxygen concentration (vol% O
2
)
F9.3E.EPS
Figure 9.3 Calculation of a One-point Calibration Curve and Correction Factors
Using a Span Gas