Real-time charting – Measurement Computing Personal Daq rev.6.0 User Manual
Page 93

Real-Time Charting
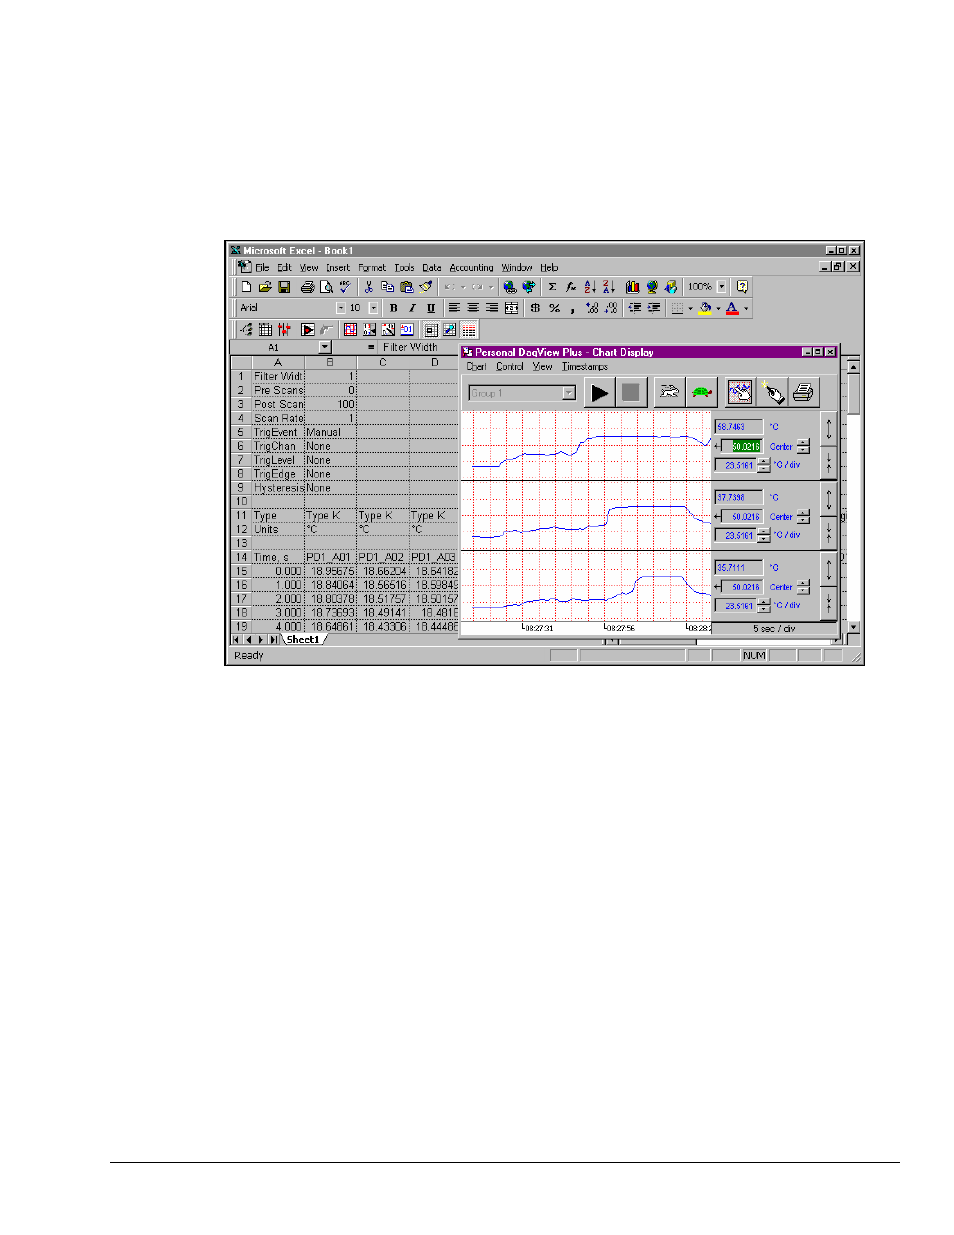
Personal DaqViewXL provides a real-time strip-chart window (as in Personal DaqView) for graphical
presentation of data. You can select up to 16 channels of data, with one channel assigned to each graph.
The strip-chart representation is continuous while data is being collected. All 16 charts are synchronized
and have an adjustable scrolling speed that can be set independent of the sampling rate. Selecting the
Charts icon in the Personal DaqViewXL toolbar will activate the following window. The chart selection
must be made prior to initiating an acquisition (selecting the Go! icon).
Personal DaqViewXL Real-Time Charting
Personal DaqViewXL User’s Guide
918596
491-0905,
rev
3.0 11
This manual is related to the following products:
