Manually configuring a chart display – Measurement Computing Personal Daq rev.6.0 User Manual
Page 76

4-34 Personal DaqView
989394
Personal Daq User’s Manual
Manually Configuring a Chart Display
If you plan to have a chart setup which is not weighted evenly, i.e., different numbers of channels per chart
and different numbers of charts per group, you may want to manually setup your chart display from
scratch, that is, without beginning from a pre-existing display configuration. This method is arrived at
from the Chart Setup Wizard window by clicking on the Manual Chart Setup, Create Charts button. When
this button is clicked, the program exits the Chart Setup Wizard and enters the manual method of Display
Configuration Setup. Although this method is referred to as “manual,” it still contains some automatic
elements, such as Automatically Add Groups to the Setup.
Note:
Even if an unevenly distributed chart display is desired, you can always edit a pre-existing chart
setup, or create a new setup by one of the Chart Setup Wizard’s automatic methods, and then edit
the setup.
To manually setup your chart display using the clean slate approach (as opposed to editing an existing
display) perform the following steps.
1. Select the Chart Setup Wizard from the Charts pull-down menu of Personal DaqView’s Chart
Display Window. The Wizard setup window appears (see following figure).
2. Click on the Manual Chart Setup, Create Charts button. The Display Configuration Setup box
appears. Since the previous display configuration was reset, no groups or charts are seen in the
display area on the left side of the screen.
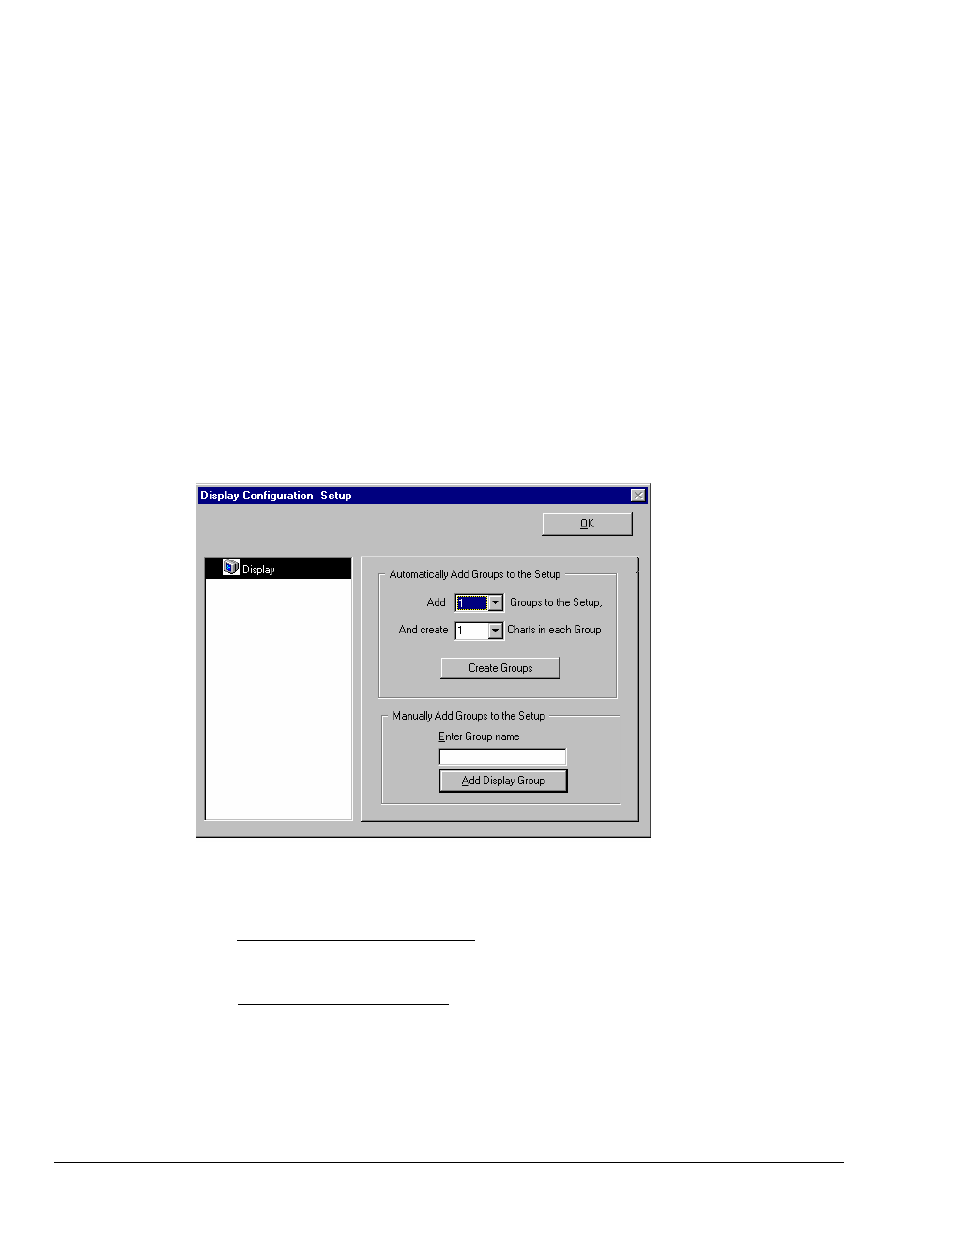
Display Configuration Setup, A “Clean Slate” Approach
3. As seen in the previous figure for the “Clean Slate” approach, you have two options at this point.
Perform (3a) or (3b) as appropriate. Option (3a) is typically used.
(3a) Automatically add groups to the setup. Enter the number of groups and charts desired by using
the cursor and typing in the value, or by using the pull-down arrows (W) and making the
appropriate selections; then click on the Create Groups button.
(3b) Manually add groups to the setup. Type in the name of the chart group; then click on the
Add Display Group button.
The Display Configuration Setup screen changes to show chart groups, and the number of charts
for the selected (black highlighted) chart group. From this screen you can change the number of
charts in a group, as well as change the group name.
