Chart display, Groups, charts, & channels, Chart display window – Measurement Computing Personal Daq rev.6.0 User Manual
Page 69
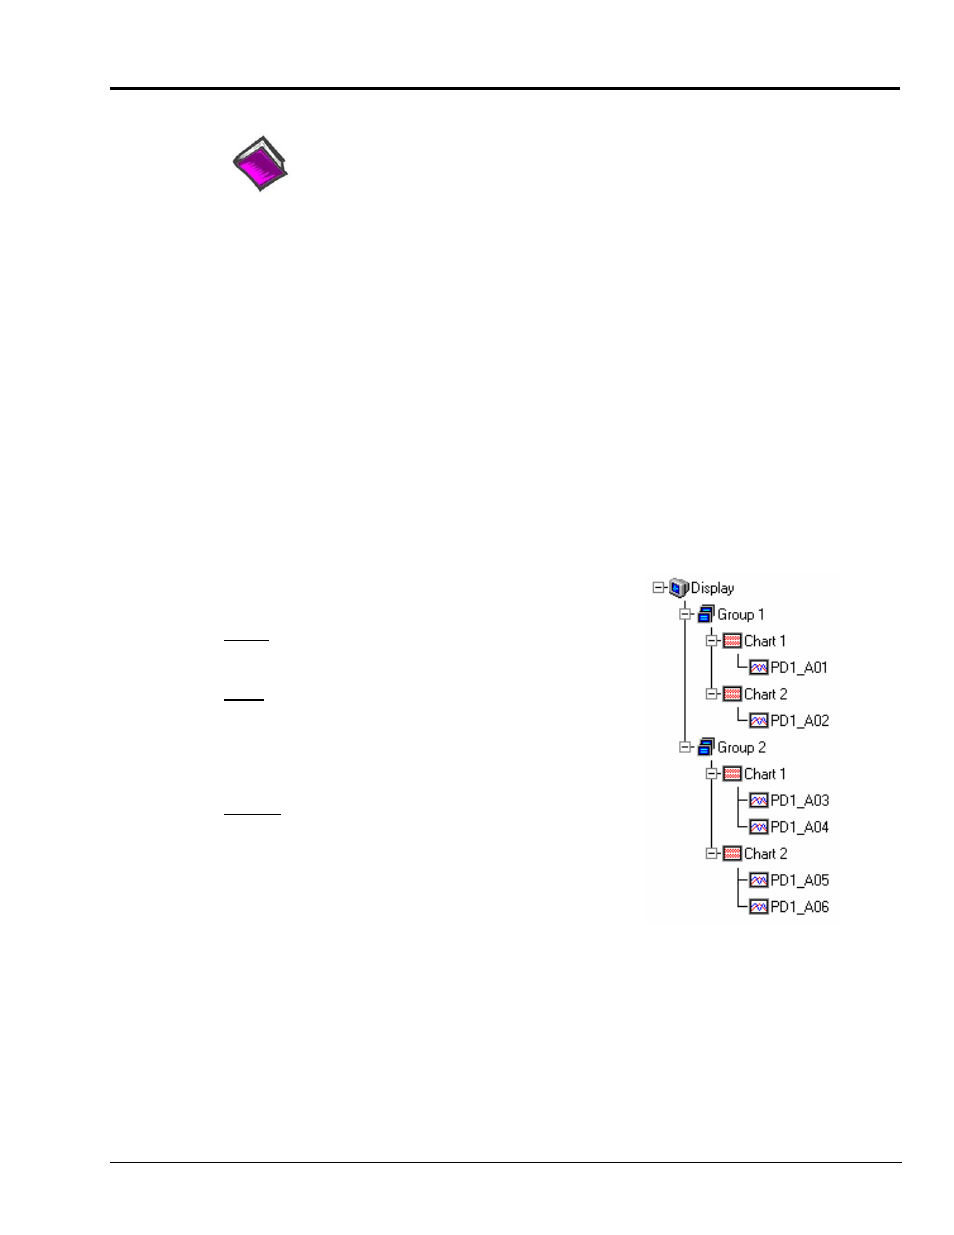
Chart Display
Reference Note: For your very first chart display setup, or when the configuration file
has been deleted, refer to the Chart Setup Wizard section beginning on page 4-37.
A Note Regarding Standard, Plus and XL Software Versions
Personal DaqView Plus permits the use of multiple groups with up to four overlapping channels per chart.
The standard version of Personal DaqView is limited to one group, and to one channel per chart. Another
distinction of the “Plus” version can be seen when using the Chart Setup Wizard feature. The “Plus”
version can make use of Simple, Moderate or Advanced automatic chart creation functions of the wizard;
however, the standard version is resricted to use of Simple mode. Discusssion of the Chart Setup Wizard
begins on page 4-37. If you do not have Personal Daq View Plus, but are interested in its expanded
features, please contact your service representative for detailed information. Note that Personal DaqView
Plus can only be activated by use of an authorized registration number.
Personal DaqView XL and Personal DaqView Plus XL function very much like their respective base
(Personal DaqView) programs, with exception that the XL version programs are “add-ins” to
Microsoft Excel
TM
and run from within the Excel environment. The XL version software allows you to
make use of Excel’s associated macros. Users of the XL version software (for Personal DaqView) should
refer to the document, Personal DaqViewXL User’s Guide, part number 491-0905. If you do not have the
XL version Personal DaqView software, but are interested in obtaining it, please contact your service
representative.
Groups, Charts, & Channels
Before continuing with this section, it is important that you
understand the chart display structure in terms of groups, charts
and channels.
Group refers to a group of charts. Note that Personal DaqView
Plus allows up to 64 groups, depending on the capabilities of
your PC, but can only display one group at a time.
Chart refers to display area, which reflects real-time channel
data values for a selected channel and can be scrolled at various
rates. You can assign up to 16 charts per group. The standard
version of Personal DaqView is limited to displaying one
channel per chart. Personal DaqView Plus can display up to
four overlapping channels per chart.
Channel refers to a signal channel. Channels will be displayed
in units of °C, °F, °K, °R, mV, V, Hz, or kHz, depending on the
configuration.
When starting the program with no configuration file present,
Personal DaqView creates a display configuration of one group,
one chart, and one channel (the first active channel found). You
can change your chart display configuration through use of a
dialog box or Chart Setup Wizard. See pages 4-31 and 4-37
respectively.
Chart Display Window
The Chart Display Window allows you to view scrolling charts for selected channels in real time. You can
access this window by selecting the Display Scrolling Charts button (located in the toolbar of the Main
Control Window). The Chart Display window contains four Pull-down menus, a toolbar, chart region, and
channel information region.
Personal Daq User’s Manual
989394
Personal DaqView 4-27