Pull-down menus – Measurement Computing Personal Daq rev.6.0 User Manual
Page 70
4-28 Personal DaqView
989394
Personal Daq User’s Manual
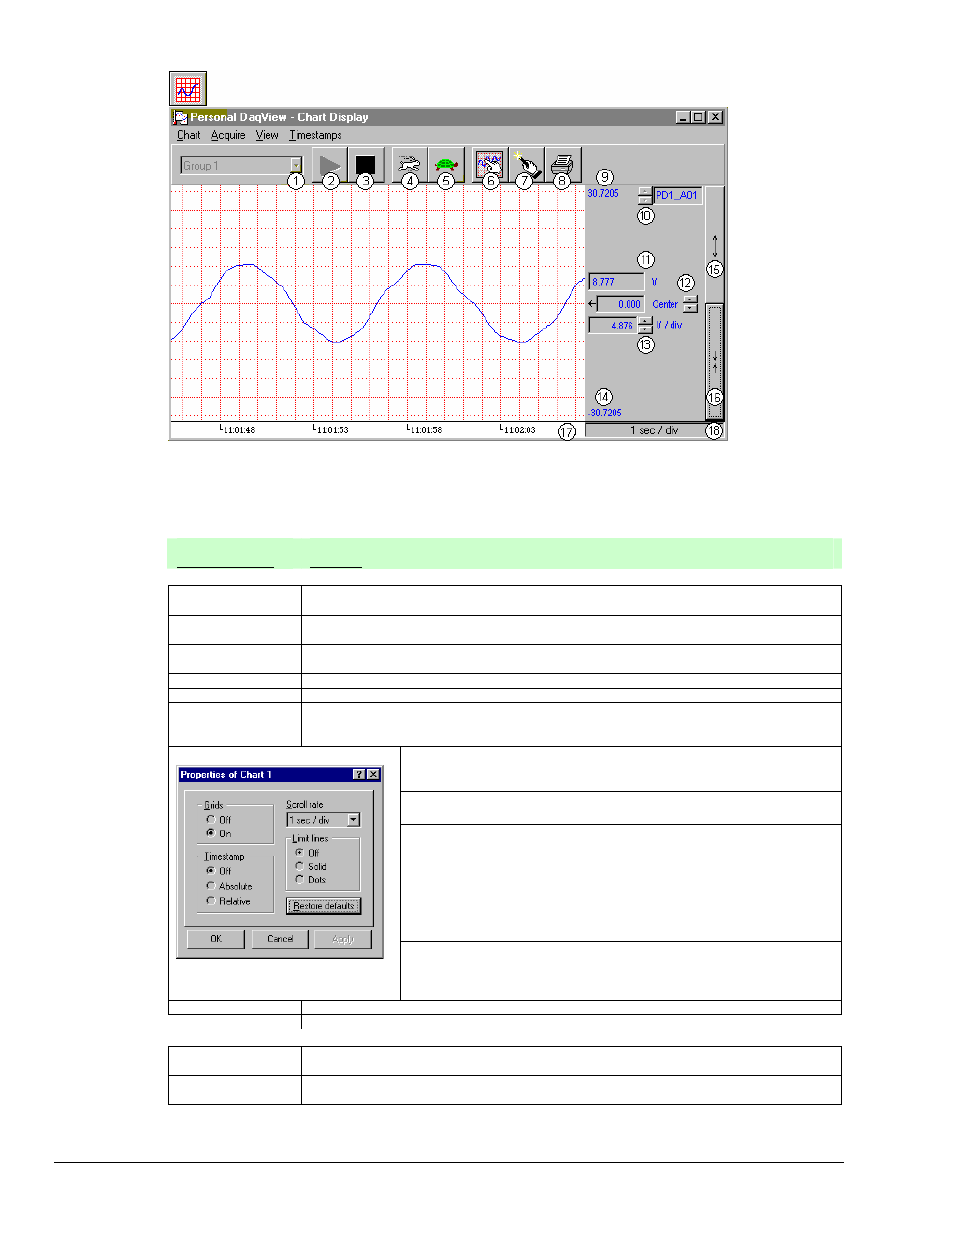
Personal DaqView’s Chart Display Window
Note: A discussion of the numbered buttons and regions begins on page 4-29.
Pull-Down Menus
Pull-Down Menu
Function
Chart
Wizard (Ctrl+W)
Opens Chart Setup Wizard for manual or automatic configuration of the chart display. Detailed
discussion of the Chart Setup Wizard begins on page 4-37.
Setup (Ctrl+D)
Accesses the Display Configuration Setup dialog box for normal editing of the current chart
display configuration. See page 4-31, Set Up Charts.
Next Group
(Ctrl+G)
Selects the next available chart group.
Faster (Ctrl+Z)
Increases the chart scroll rate, as does the toolbar’s rabbit button.
Slower (Ctrl+X)
Decreases the chart scroll rate, as does the toolbar’s turtle button.
Zoom
When more than one chart is displayed, this feature allows you to zoom in on one of the
charts, such that only the selected chart is displayed. From this “zoomed state” you can use
the feature to return the display to normal (Un-zoom), or to select another available chart.
Note: The Properties box is enabled in PersonalDaq’s Plus and Trial
versions only.
Grids – Turns grid lines on or off for the indicated chart.
Timestamp – Allows selection of absolute or relative timestamps; and
provides a means of turning off the timestamp.
Scroll Rate - Sometimes referred to as “chart speed.” Selects the indicated
chart’s scroll rate in “time per division.” Scroll rate can be as fast as 0.1
sec/div and as slow as 1 hour/div, with several other rates to choose
from. The rabbit and turtle buttons, and Faster (Ctrl+Z) and Slower
(Ctrl+X) commands also affect scroll rate.
Note: The rate indicated in area 18 of the Chart Display figure
[above] is the “global” scroll rate. It is not necessarily the same as
the scroll rate set in the chart’s Properties box.
Properties
Properties Box
Limit Lines – Allows limit lines (marking the upper and lower limits of the
chart) to be displayed as solid or dotted lines; and provides a means of
turning the limit lines off.
Close
Exits the Chart pull-down menu.
Acquire
Start Charts
Display
Starts the scrolling chart display. Does not affect the recording of data to disk.
Stop Charts
Display
Stops the scrolling chart display. Does not affect the recording of data to disk.