Chart and channel information regions – Measurement Computing Personal Daq rev.6.0 User Manual
Page 72

4-30 Personal DaqView
989394
Personal Daq User’s Manual
Chart and Channel Information Regions
Channels can return values in engineering units of °C, °F, °K, °R, mV, V, Hz, kHz, or user defined units.
With exception of user defined units, engineering units depend on the configuration, for example, whether
a voltage type or temperature type sensor is being used. The Channel Information Region is located on the
right-hand side of Personal DaqView’s Chart Display Window. The values displayed in this region are the
real-time values of the selected channel.
By clicking on the up or down arrows (
V
, or
W
) by the channel selection box (item 10), you can select one
of a maximum of 4 channels that were assigned to that chart. This allows you to observe the chart-related
information for that specific channel. You can also select a new channel for the information region by
placing the cursor in (or tabbing over to) the “Center” or “Units/Div” fields and then pressing PageUp or
PageDown. This is particularly useful when your Chart Display Window has been re-sized such that the
channel selection boxes are not visible.
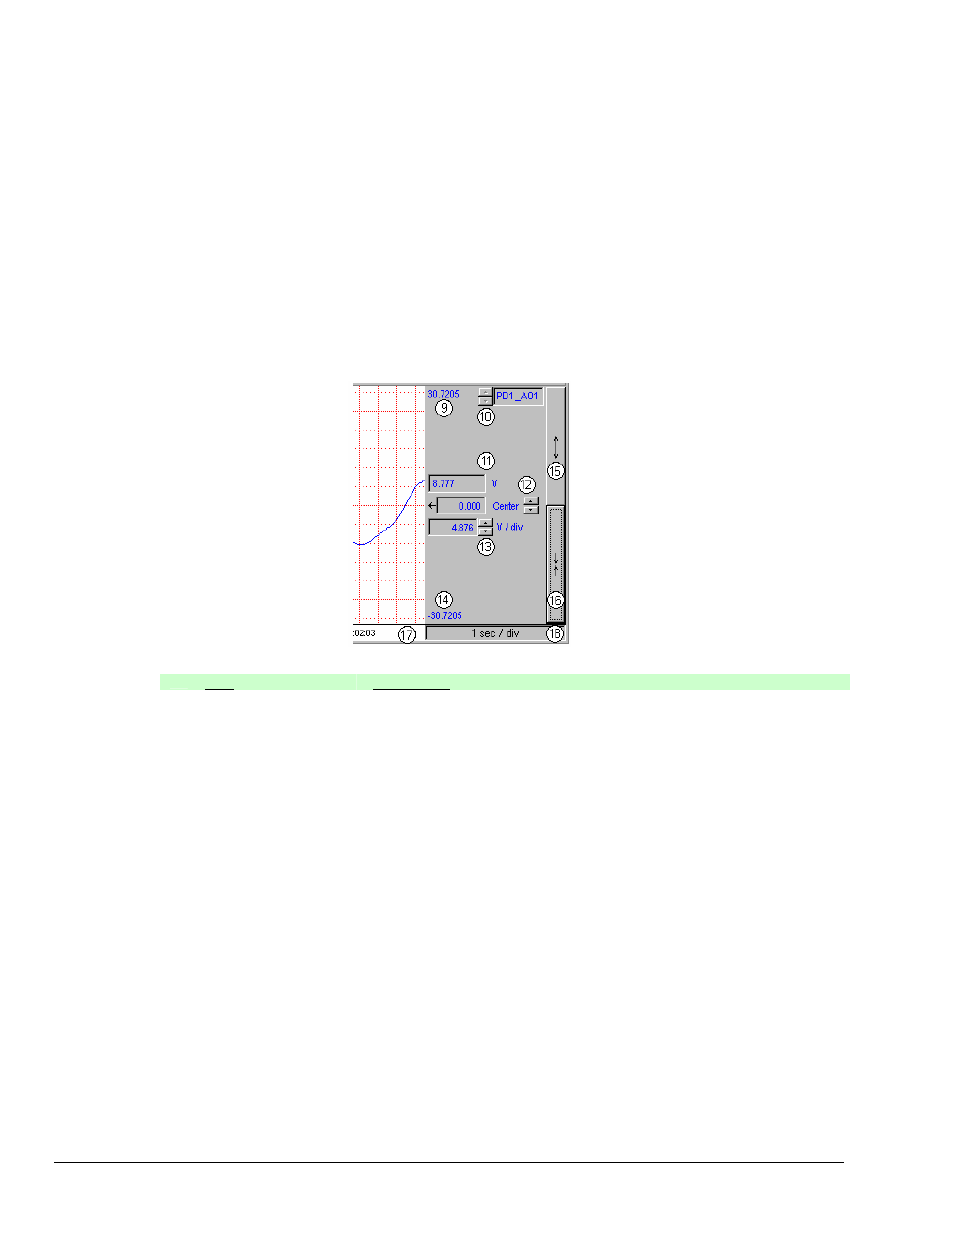
The following list identifies areas of the channel information region.
Channel Information Region
Item
Description
9
Chart Maximum Scale
Value (Grid Limit Line)
The value at the upper grid limit line. This is the value at the high end of the scale.
10 Channel
Selection
Used to select the channel (of chart group's available channels) for which the
information will be displayed. Displays the label of the channel for which information
is being displayed.
11 Present
Value
The real-time value of the selected channel.
12 Center
Used to display (and change) the value of the selected channel’s chart centerline.
Changing the value of center results in an automatic change of the chart’s high and
low end values (items 9 and 14, and possibly an automatic change of the units/div
(item 13). Aside from using the center spinner controls to change center, you can
change the center value by placing the mouse cursor in (or tabbing over to) the field
and then either typing in the desired value, or using the PC keyboard up and down
arrow control keys.
13 Units/Division
(Provides
the vertical increment of
one grid box)
The units in units/div can be °C, °F, °K, °R, µV, mV, V, kHz, or Hz. The division
referenced is one vertical grid. In the example above for PD1_A02, each vertical
grid increment represents 4.876 V per division. Changing the units/division spinner
controls (V/W) will result in an automatic adjustment of the max scale and min scale
values (items 9 and 14). Aside from using the units/div triangular controls to change
the value, you can change units/div by placing the mouse cursor in (or tabbing over
to) the field and then either typing in the desired value, or using the PC keyboard
arrow control keys.
14
Chart Minimum Scale
Value (Grid Limit Line)
The value at the lower grid limit line. This is the value at the low end of the scale.
