Thermal performance information, Thermal performance curves (maxi), Design guide & applications manual – Vicor Micro Family of DC-DC Converter User Manual
Page 27: Page 26 of 88
Design Guide & Applications Manual
For Maxi, Mini, Micro Family DC-DC Converters and Configurable Power Supplies
Maxi, Mini, Micro Design Guide
Rev 4.9
vicorpower.com
Page 26 of 88
Apps. Eng. 800 927.9474
800 735.6200
6. Thermal Performance Information
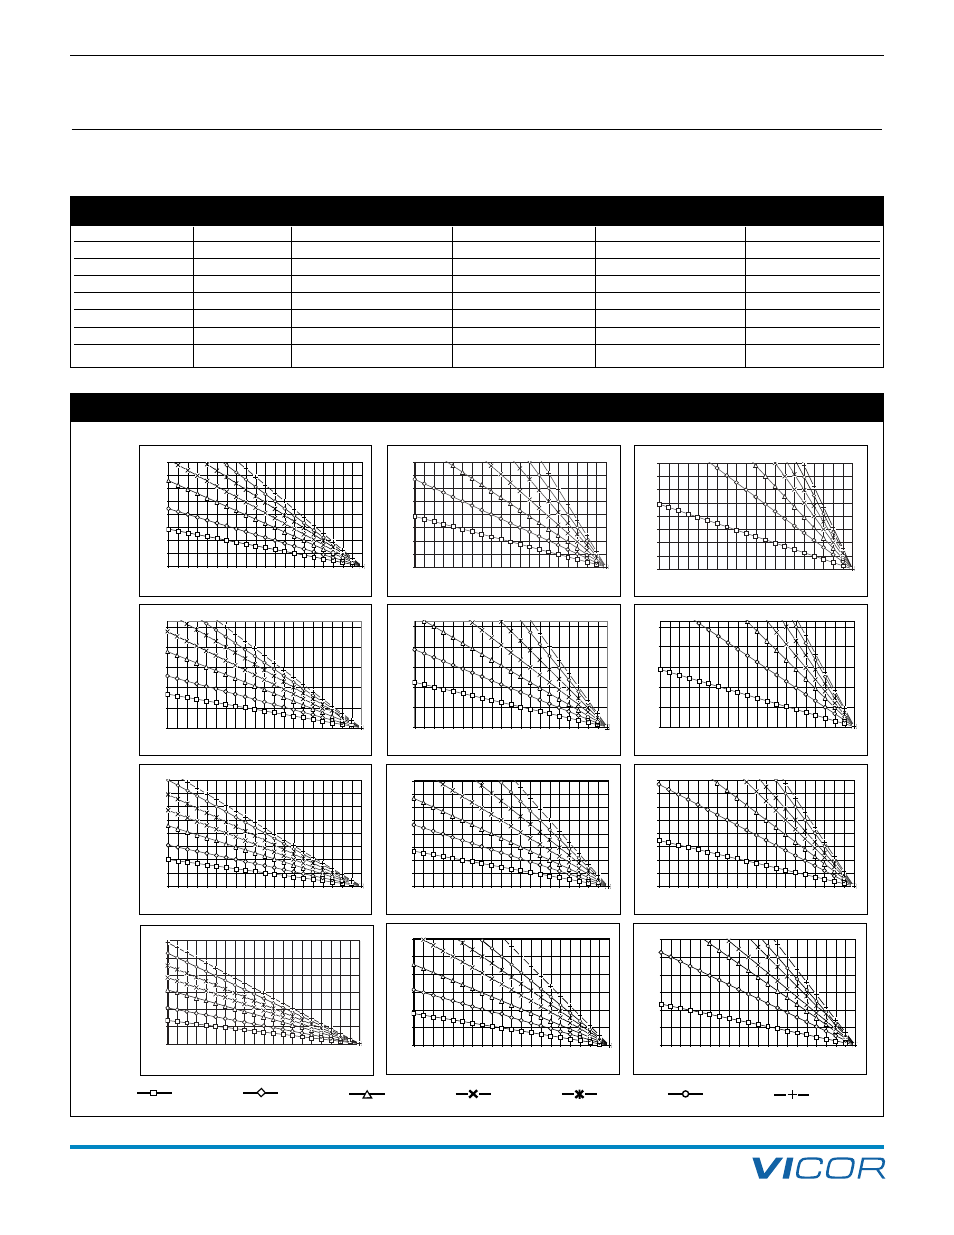
THERMAL PERFORMANCE CURVES (Maxi)
Table Usage: The forced convection thermal impedance data shown in the tables on the next three pages assumes airflow through the heat
sink fins. Actual airflow through the fins should be verified. For purposes of heat sink calculation, assume efficiencies listed on Maxi data
sheets. Use as a design guide only. Verify final design by actual temperature measurement.
0
20
40
60
80
100
120
140
160
0
5
10
15
20
25
30
35
40
45
50
55
60
65
70
75
80
85
90
95
100
Ambient Temperature (deg C)
Output P
o
wer (W
atts)
0
20
40
60
80
100
120
140
160
0
5
10
15
20
25
30
35
40
45
50
55
60
65
70
75
80
85
90
95
100
Ambient Temperature (deg C)
Output P
ow
e
r (W
atts)
0
20
40
60
80
100
120
140
160
0
5
10
15
20
25
30
35
40
45
50
55
60
65
70
75
80
85
90
95
100
Ambient Temperature (deg C)
Output P
ow
e
r (W
atts)
0
50
100
150
200
250
0
5
10
15
20
25
30
35
40
45
50
55
60
65
70
75
80
85
90
95
100
Ambient Temperature (deg C)
Output P
o
wer (W
atts)
0
50
100
150
200
250
0
5
10
15
20
25
30
35
40
45
50
55
60
65
70
75
80
85
90
95
100
Ambient Temperature (deg C)
Output P
o
wer (W
atts)
0
50
100
150
200
250
0
5
10
15
20
25
30
35
40
45
50
55
60
65
70
75
80
85
90
95
100
Ambient Temperature (deg C)
Output P
o
wer (W
atts)
0
50
100
150
200
250
300
350
400
0
5
10
15
20
25
30
35
40
45
50
55
60
65
70
75
80
85
90
95
100
Ambient Temperature (deg C)
Output P
o
wer (W
atts)
0
50
100
150
200
250
300
350
400
0
5
10
15
20
25
30
35
40
45
50
55
60
65
70
75
80
85
90
95
100
Ambient Temperature (deg C)
Output P
o
wer (W
atts)
0
50
100
150
200
250
300
350
400
0
5
10
15
20
25
30
35
40
45
50
55
60
65
70
75
80
85
90
95
100
Ambient Temperature (deg C)
Output P
o
wer (W
atts)
Baseplate (No Heat Sink)
0.4'' (10,1 mm) Heat Sink
0.9'' (22,8 mm) Heat Sink
2 V
3.3 V
5 V
12 – 54 V
θ
bs
= 0.07°C/W
Baseplate
0.9'' Longitudinal Fins
0.9'' Transverse Fins
0.4'' Longitudinal Fins
0.4'' Transverse Fins
Free Air
4.98
2.89
2.24
3.72
3.49
200 LFM
3.23
1.30
1.02
2.14
1.53
400 LFM
2.17
0.90
0.72
1.48
1.08
600 LFM
1.73
0.72
0.60
1.10
0.87
800 LFM
1.46
0.59
0.51
0.86
0.70
1,000 LFM
1.27
0.51
0.44
0.71
0.60
1,200 LFM
1.14
0.46
0.41
0.61
0.55
Free Air
200 LFM
400 LFM
600 LFM
800 LFM
1000 LFM
1200 LFM
Maxi Output Power vs. Ambient Temperature Derating Curves
Maxi θ
ba
(Baseplate-to-Ambient Thermal Resistance Values) vs. Airflow
12 - 48V Maxi Thermal Performance Curves - No Heat Sink
0
100
200
300
400
500
600
0
5
10
15
20
25
30
35
40
45
50
55
60
65
70
75
80
85
90
95
100
Ambient Temperature (deg C)
Output Power (W
atts)
12 - 48V Maxi Thermal Performance Curves - .4" Heat Sink
0
100
200
300
400
500
600
0
5
10
15
20
25
30
35
40
45
50
55
60
65
70
75
80
85
90
95
100
Ambient Temperature (deg C)
Power Output (Watts)
12 - 48V Maxi Thermal Performance Curves - .9" Heat Sink
0
100
200
300
400
500
600
0
5
10
15
20
25
30
35
40
45
50
55
60
65
70
75
80
85
90
95
100
Ambient Temperature (deg C)
Power Output (Watts)