Adding a chart – Apple Keynote 2 User Manual
Page 92
92
Chapter 6
Creating Charts
 In a pie chart, only a single data set—the first data point in each series—is
represented on the chart (whichever is listed first in the Chart Data Editor).
Adding a Chart
To place a chart on the slide canvas:
1
Choose Insert > Chart (or click Chart in the toolbar).
A chart containing placeholder data appears on the slide, and the Chart Inspector and
Chart Data Editor open.
2
To resize the chart, drag a selection handle.
3
To reposition the chart, drag it (avoid placing the pointer on a selection handle).
4
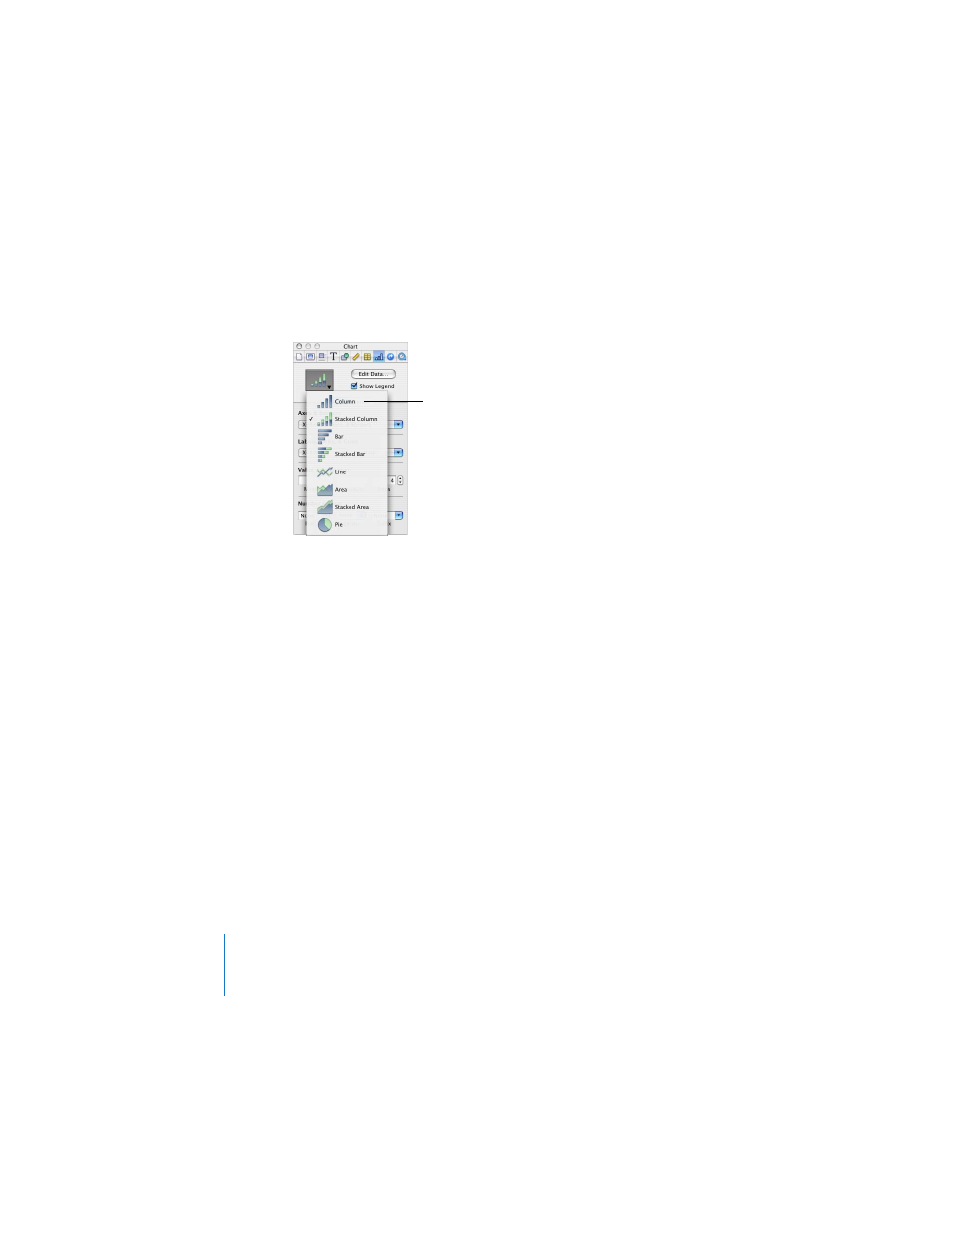
To change the chart type, choose an option from the pop-up menu in the Chart
Inspector.
You can also draw a chart on a slide.
To draw a chart on the slide canvas:
1
Hold down the Option key and click Chart in the toolbar.
2
Release the Option key, and move the pointer over the slide canvas until it becomes a
crosshair.
3
Drag across the slide canvas to create a chart any size you want.
To constrain the chart’s proportions, hold down the Shift key as you drag.
Choose from eight
different chart types in
the Chart Inspector.
- Numbers '09 (254 pages)
- Keynote '09 (247 pages)
- Pages '09 (279 pages)
- Boot Camp Mac OS X v10.6 Snow Leopard (18 pages)
- Boot Camp Mac OS X v10.6 Snow Leopard (19 pages)
- iWork '09 (372 pages)
- Mac OS X v10.6 Snow Leopard (7 pages)
- GarageBand '08 (102 pages)
- iDVD '08 (35 pages)
- GarageBand '09 (122 pages)
- iWeb (37 pages)
- iMovie '08 (50 pages)
- Boot Camp (Mac OS X v10.5 Leopard) (27 pages)
- Boot Camp (Mac OS X v10.5 Leopard) (25 pages)
- Mac OS X v10.5 Leopard (16 pages)
- Mac OS X (622 pages)
- Mac OS X Server (Version 10.6 Snow Leopard) (197 pages)
- Mac OS (42 pages)
- Mac OS X Server (Upgrading and Migrating For Version 10.4 or Later) (97 pages)
- iMovie HD (47 pages)
- iMovie HD (83 pages)
- MAC OS 7.6.1 (4 pages)
- Mac OS X Server (Extending Your Wiki Server For Version 10.5 Leopard) (45 pages)
- Mac OS X Server Ver 10.4 (35 pages)
- Mac OS X Server v10.6 (76 pages)
- Mac OS X Server v10.6 (97 pages)
- Macintosh Japanese Language Kit (30 pages)
- Xserve (Early 2008) DIY Procedure for Hard Drive (3 pages)
- Xserve (8 pages)
- Xserve (60 pages)
- GarageBand 3 (98 pages)
- Remote Desktop 3.1 (191 pages)
- Motion 5.1.1 (1090 pages)
- Workgroup Server 8150/110 (144 pages)
- Aperture (476 pages)
- Xserve Intel (Late 2006) DIY Procedure for Optical Drive Cable (7 pages)
- Xserve Intel (Late 2006) DIY Procedure for Optical Drive Cable (6 pages)
- Network Services Location Manager Network (8 pages)
- Macintosh System 7.5 (126 pages)
- Macintosh System 7.5 (114 pages)
- Macintosh System 7.5 (65 pages)
- DVD Studio Pro 4 (656 pages)
- Keynote '08 (204 pages)
- Xsan 2 (Second Edition) (11 pages)
- LiveType 2 (157 pages)