31 display > graph header menu, 31 display > graph header menu -52, Boonton 4540 series rf power meter – Boonton 4540 Peak Power Meter User Manual User Manual
Page 100: Operation
Boonton 4540 Series RF Power Meter
Operation
4-52
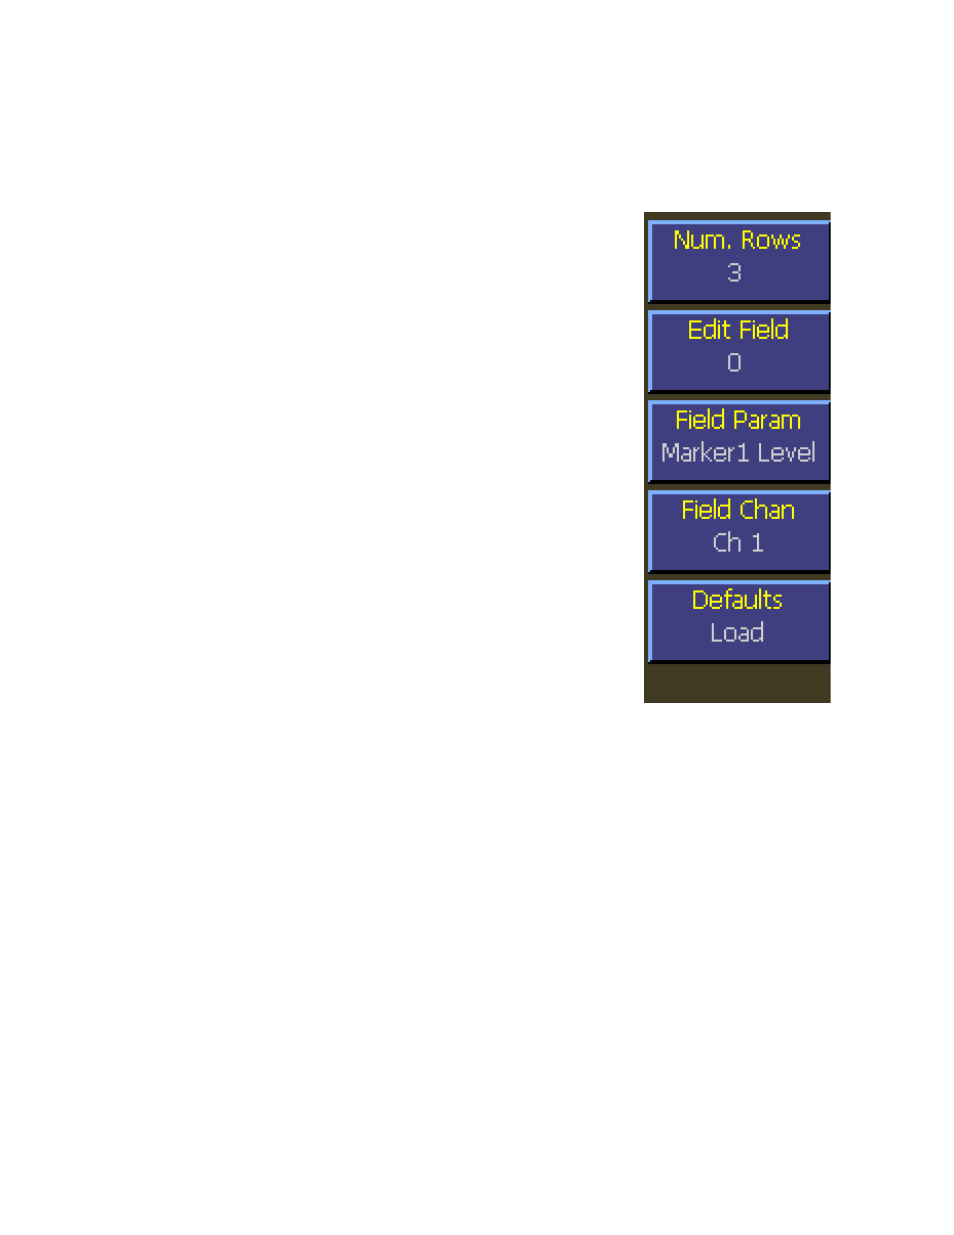
4.5.31 Display > Graph Header Menu
The Graph header menu is used to customize the text fields above the graph in graphical display mode. There is a different
group of settings for each measurement mode.
Main Pg 2 > Display > Graph Header > Num. Rows
Description:
Set the number of rows of measurement or parameter
text above the Graph.
Menu Type:
Numeric Value.
Range:
0 to 5
Main Pg 2 > Display > Graph Header > Edit Field
Description:
Set the text field above the Graph to be edited. The
selected field can then be changed using the Field
Param and Field Chan menu items. Thefield
numbers use a zero-based index and start at the upper
left corner. The selected field will be highlighted
unless it is not visible on the display.
Menu Type:
Numeric Value. (Range: 0 to 9)
Main Pg 2 > Display > Graph Header > Field Param
Description:
Set the automatic measurement or setting displayed
in the graph header field selected by the Edit Field
menu item.
Menu Type:
Pop-up Selection.
Choices:
See table 4-1 for a list of Field Parameters.
Main Pg 2 > Display > Graph Header > Field Chan
Description:
Set the channel associated with the graph header field selected by the Edit Field menu
item.
Menu Type:
Toggle. (Choices: Ch 1, Ch 2)
Main Pg 2 > Display > Graph Header > Defaults
Description:
Loads the default parameters for the Graph header for the current measurement mode.
Menu Type:
Toggle. (Choices: Ch 1, Ch 2)
Fig. 4-42 Graph Header
Menu