Jenway 6715 User Manual
Page 85
67
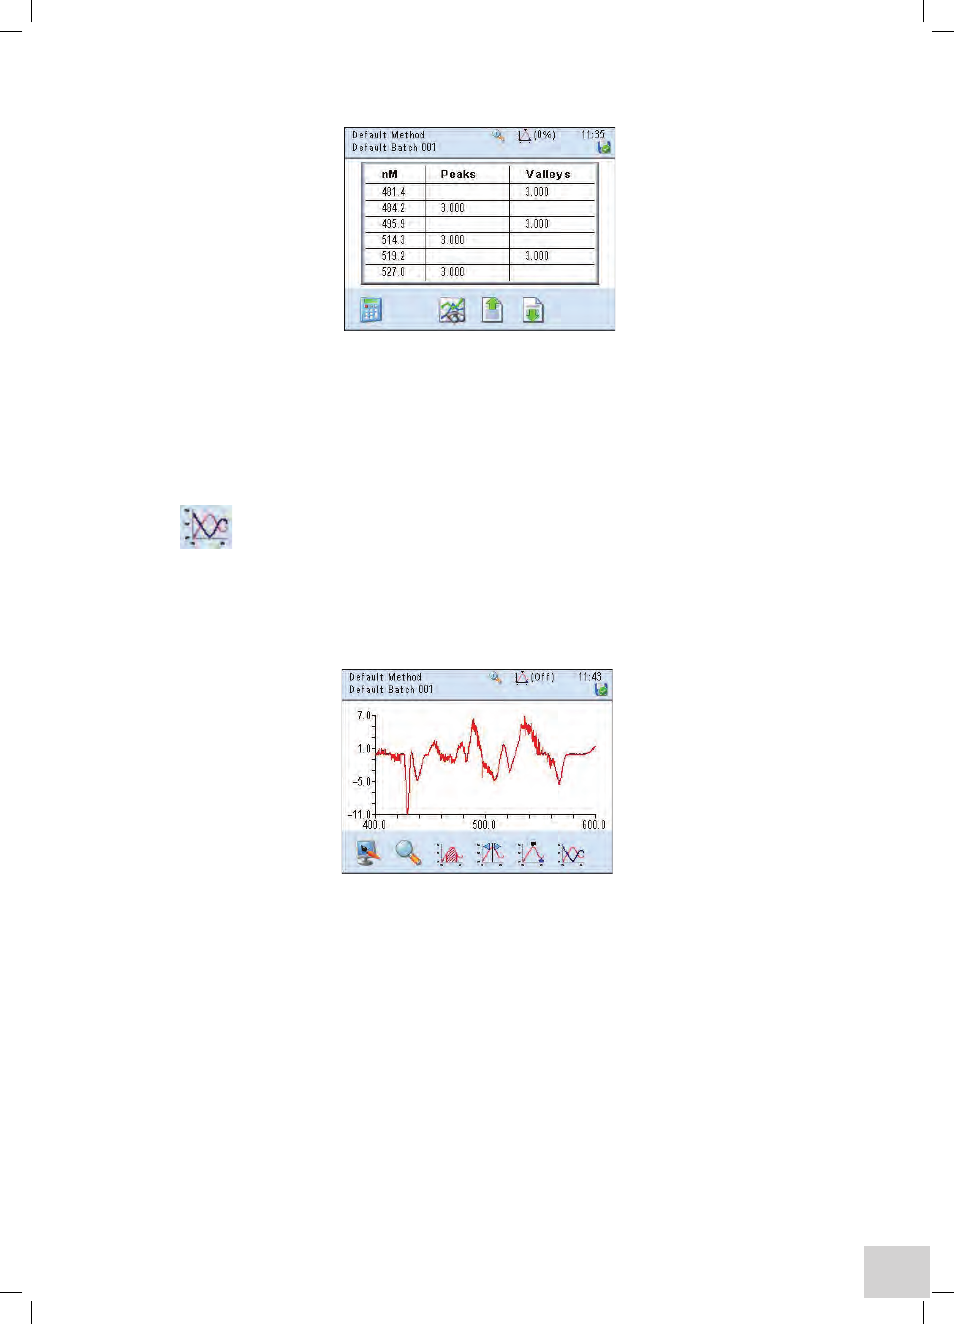
Selecting the
Find Peaks & Valleys Table icon displays the peaks and valleys in a table.
Scrolling through the table can be carried out using the
Scroll Down and Scroll Up icons.
Selecting the
Display Spectrum with Peaks and Valleys icon at any time returns to the spectrum
display.
obtaining Derivative Spectra
toolbar icon
Select Derivative
To obtain a derivative spectra select the
Select Derivative icon and choose which derivative is
required (the range is from None to 4
th
Derivative). The spectrum derivative display is updated to show
the spectrum.
Selecting the
Back key returns to the original spectrum.