Jenway 6715 User Manual
Page 84
66
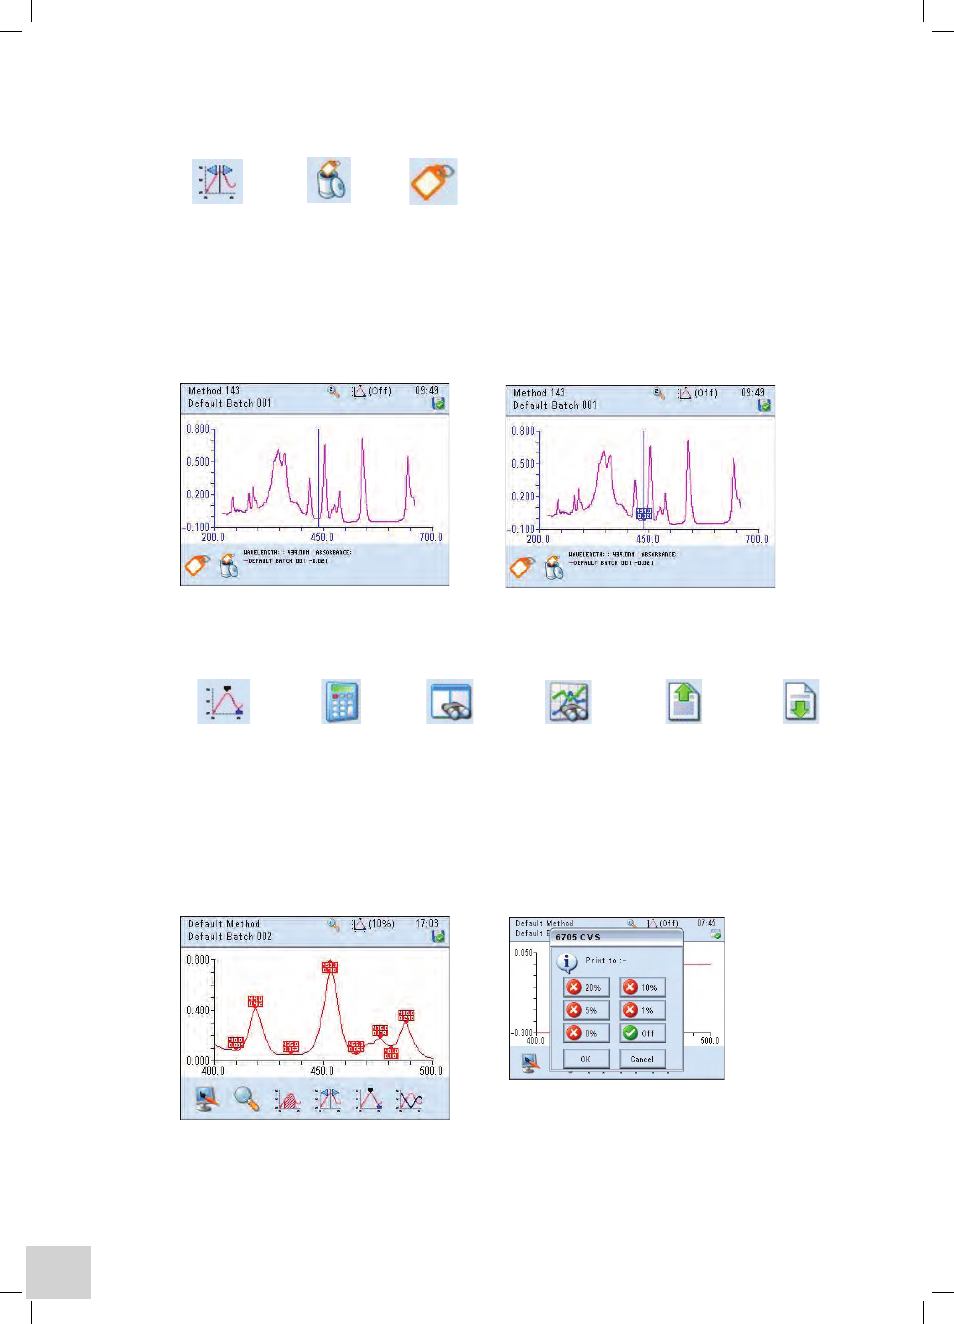
Co-ordinate tagging
toolbar icons
Co-ordinate Tagging Tag Delete Tag
Peaks, valleys or any other points of interest can be selected (on the current, zoomed or recalled
spectra) and have a co-ordinate tag added for future reference.
Selecting the
Co-ordinate Tag icon enables the QWheel™ to control the displayed cursor. With the
cursor on the required point pressing the
Tag icon will add a tag at this point. All tags can be removed
by selecting the
Delete Tag icon.
Auto Peak & Valley tagging
toolbar icons
Peak & Valley Calculate Find Peaks Display spectrum
Scroll Up Scroll Down
Tagging
& Valleys Table with Peaks & Valleys
Peaks and valleys can be automatically identified on current, zoomed or recalled spectra. Selecting the
Peak and Valley icon will cause the scan to be re-drawn with all peaks and valleys identified with
co-ordinate tags. The initial display is with a setting of 20% (defined as any turning point where the
maximum or minimum value reached is 20% greater or less than the previous turning point). The
sensitivity can be adjusted by selecting the
Calculate icon and choosing the required sensitivity.