User-defined graphs, Canvas configurations, User-defined graphs canvas configurations – Brocade Web Tools Administrators Guide (Supporting Fabric OS v7.3.0) User Manual
Page 129
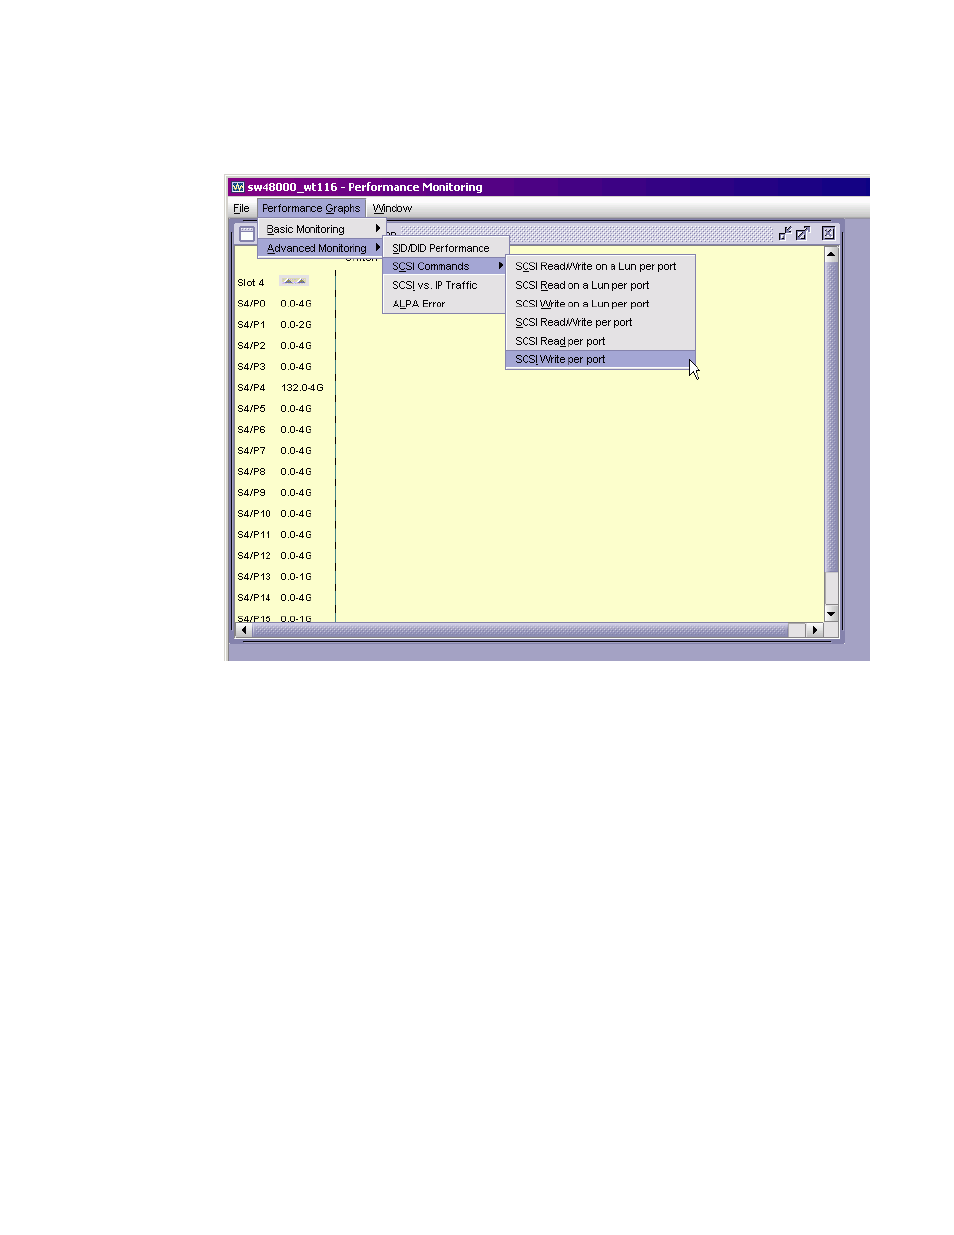
FIGURE 21 Accessing performance graphs
User-defined graphs
You can modify the predefined graphs to create your own customized graphs (refer to
on page 131 for more information). These user-defined graphs can be added
and saved to canvas configurations.
Canvas configurations
A canvas is a saved configuration of graphs. The graphs can be either the Web Tools predefined
graphs or user-defined graphs. Each canvas can hold up to eight graphs per window, with six shown in
the following figure. Up to 20 canvases can be set up for different users or different scenarios. Each
canvas is saved with a name and an optional brief description.
User-defined graphs
Web Tools Administrator's Guide
129
53-1003169-01
See also other documents in the category Brocade Computer Accessories:
- ICX 6650 Hardware Installation Guide (98 pages)
- FastIron Ethernet Switch Administration Guide (362 pages)
- FastIron Ethernet Switch Feature and RFC Support Matrix (66 pages)
- FastIron Ethernet Switch Traffic Management Guide (100 pages)
- FastIron Ethernet Switch Stacking Configuration Guide (160 pages)
- FastIron Ethernet Switch Software Upgrade Guide (121 pages)
- FastIron Ethernet Switch Software Licensing Guide (58 pages)
- FastIron Ethernet Switch Security Configuration Guide (396 pages)
- FastIron Ethernet Switch Platform and Layer 2 Switching Configuration Guide (454 pages)
- FastIron Ethernet Switch Layer 3 Routing Configuration Guide (672 pages)
- FastIron Ethernet Switch IP Multicast Configuration Guide (230 pages)
- FastIron SX, FCX, and ICX Diagnostic Reference (222 pages)
- ICX 7750 Hardware Installation Guide (80 pages)
- Network OS YANG Reference Manual v4.1.1 (238 pages)
- Network OS Software Licensing Guide v4.1.0 (34 pages)
- Network OS NETCONF Operations Guide v4.1.1 (622 pages)
- Network OS Message Reference v4.1.1 (478 pages)
- Network OS Feature and RFC Support Matrix (16 pages)
- Network OS Command Reference v4.1.0 (1418 pages)
- Network OS Administrator’s Guide v4.1.1 (748 pages)
- Mid-Mount Rack Kit (Switch) Installation Procedure (Supporting 300, 5100, 5300, 6505, 6510, 6520, 7800, 8000, VA-40FC, VDX 6710-54, and VDX 6740) (10 pages)
- Flush Mount Rack Kit Installation Procedure (Supporting VDX 6710-54, VDX 6720-24, VDX 6720-60, VDX 6730-32, VDX 6730-76, and VDX 6740) (10 pages)
- VDX 6710-54 QuickStart Guide (12 pages)
- VDX 6710-54 Hardware Reference Manual (72 pages)
- VDX 6730 Hardware Reference Manual (Supporting VDX 6730-32 and VDX 6730-76) (90 pages)
- VDX 6730 QuickStart Guide (Supporting VDX 6730-32 and VDX 6730-76) (12 pages)
- Fixed Rack Mount Kit Installation Procedure (Supporting 300, 5100, 5300, 6520, 7800, 8000) (12 pages)
- VDX 8770-8 Two-Post Flush and Mid-Mount Rack Kit Installation Procedure (8 pages)
- VDX 8770-8 QuickStart Guide (34 pages)
- VDX 8770-8 Hardware Reference Manual (136 pages)
- VDX 8770-8 Four-Post Flush and Recessed Mount Rack Kit Installation Procedure (10 pages)
- VDX 8770-4 Two-Post Flush and Mid-Mount Rack Kit Installation Procedure (10 pages)
- VDX 8770-4 QuickStart Guide (32 pages)
- VDX 8770-4 Hardware Reference Manual (132 pages)
- VDX 8770-4 Four-Post Flush Mount Rack Kit Installation Procedure (8 pages)
- VDX 8770-4 Four-Post Flush and Recessed Mount Intake Air Duct Rack Kit Installation Procedure (24 pages)
- VDX 6740 Hardware Reference Manual (Supporting VDX 6740, VDX 6740T, and VDX 6740T-1G) (78 pages)
- Universal Four Post Rack Kit Installation Procedure (Supporting VDX 6740T) (20 pages)
- Universal Two-Post Rack Kit Installation Procedure (Supporting VDX 6740T) (12 pages)
- FCX Series Hardware Installation Guide (112 pages)
- 6910 Ethernet Access Switch MIB Reference (102 pages)
- 6910 Ethernet Access Switch Hardware Installation Guide (84 pages)
- 6910 Ethernet Access Switch Diagnostic Guide (Supporting R2.2.0.0) (88 pages)
- 6910 Ethernet Access Switch Configuration Guide (Supporting R2.2.0.0) (1240 pages)
- Unified IP MIB Reference (Supporting Multi-Service IronWare Release 05.6.00a) (771 pages)