PASCO EM-8656 AC_DC ELECTRONICS LABORATORY User Manual
Page 65
61
012-05892A
AC/DC Electronics Laboratory
®
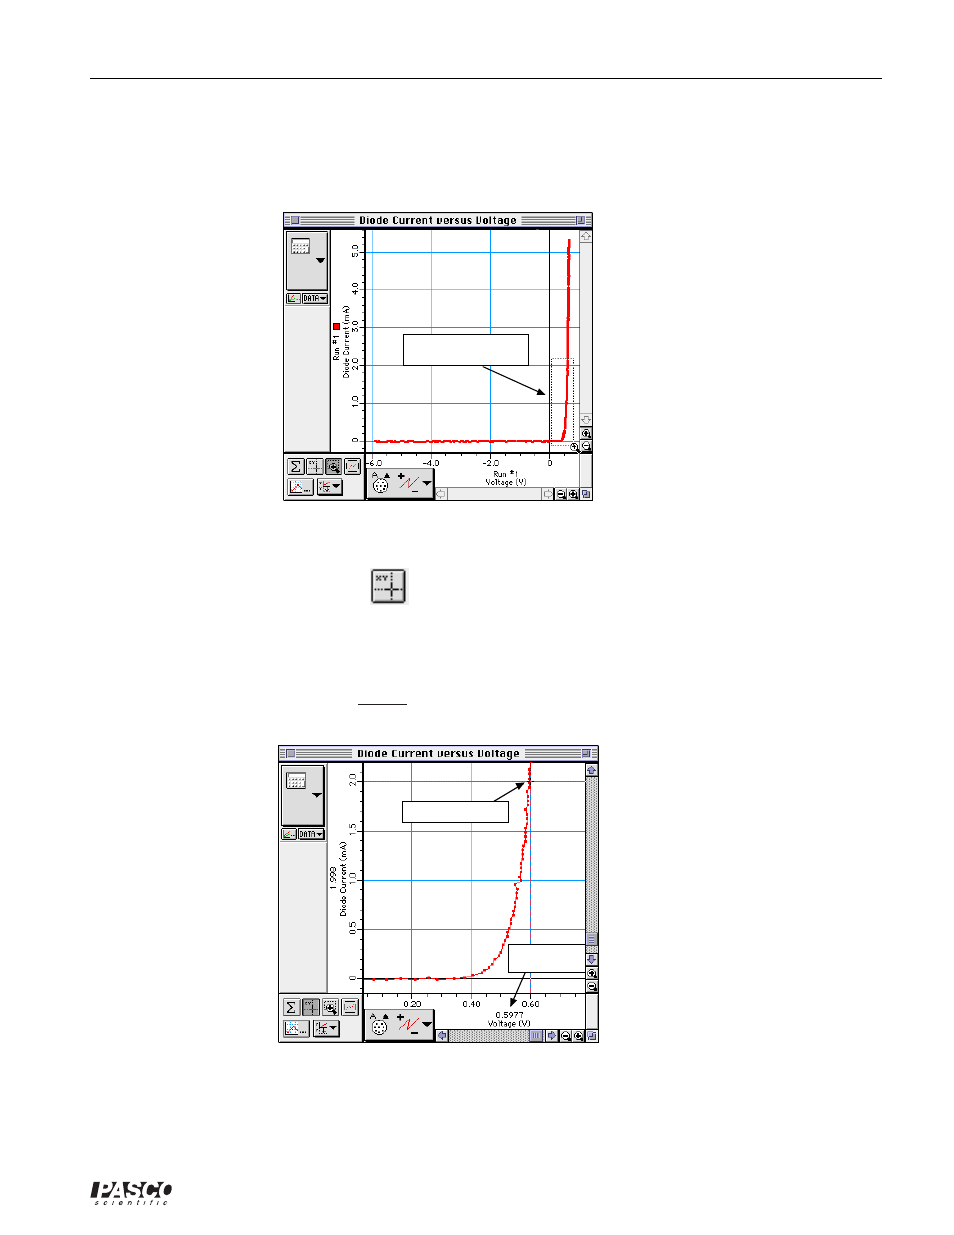
➃
Use the cursor to click-and-draw a rectangle around the region of the plot of current and voltage
where the current begins to increase. Make the rectangle tall enough so that its upper boundary is
beyond 2 milliamp (mA).
Click-and-draw rectangle
around region of interest
•
The Graph will rescale to fit the data in the area you selected.
➄
Click the “Smart Cursor” button (
).
•
The cursor changes to a cross-hair. The Y-coordinate of the cross-hair is displayed near the
vertical axis. The X-coordinate of the cross-hair is displayed below the horizontal axis.
➅
Move the cursor/cross-hair to the point on the plot where the current reaches 2 milliamps.
Record the value of the turn-on voltage (X-coordinate) at 2 mA in the Data Table.
Smart Cursor at 2 mA
X-coordinate,
turn-on voltage
- UI-5000 850 Universal Interface Quick Start (1 page)
- UI-5000 850 Universal Interface Instruction Manual (24 pages)
- PS-2193 High Current Sensor (2 pages)
- ME-8979 Mass and Hanger Set (1 page)
- ME-9498A Photogate Head (3 pages)
- ME-6821A Photogate Mounting Bracket (2 pages)
- ME-6825A MINI LAUNCHER (39 pages)
- ME-6810 Time of Flight Accessory (24 pages)
- ME-8574 DISCOVER FRICTION ACCESSORY (4 pages)
- PS-2103A Motion Sensor (4 pages)
- PS-2189 High Resolution Force Sensor (2 pages)
- ME-9448B Super Pulley with Clamp (2 pages)
- ME-6955 1.2 m PAScar Dynamics System (27 pages)
- PS-2104 Force Sensor (2 pages)
- ME-8998 Elastic Bumper Kit (2 pages)
- ME-6843 Spring Cart Launcher (9 pages)
- ME-6950 PAScar with Mass (29 pages)
- PS-2120A Rotary Motion Sensor (9 pages)
- PS-2120A Rotary Motion Sensor (17 pages)
- ME-9821 Centripetal Force Pendulum (18 pages)
- ME-8088 Centripetal Force Apparatus (20 pages)
- ME-8735 Large Rod Stand (2 pages)
- CI-6545 Force Accessory Bracket (3 pages)
- ME-9806 Photogate Brackets (1 page)
- CI-6692 IDS MOUNT ACCESSORY (2 pages)
- ME-6569 RMS_IDS KIT (36 pages)
- ME-6829 Mini Launcher Ballistic Pendulum (18 pages)
- ME-9889 Discover Free Fall System (10 pages)
- SE-7256 Motion Sensor Guard (2 pages)
- ME-8973 Discover Collision Bracket (2 pages)
- AP-8214A Stress_Strain Apparatus (12 pages)
- CI-6691 MINI-ROTATIONAL ACCESSORY (2 pages)
- ME-9833 Physical Pendulum Set (30 pages)
- OS-8473 POLARIZER SET (2 pages)
- PS-2343 USB Camera (2 pages)
- AP-8215A Gravitational Torsion Balance (20 pages)
- OS-8526A X-Y ADJUSTABLE DIODE LASER (2 pages)
- Xplorer-GLX Users’ Guide (152 pages)
- PS-2150 Broad Spectrum Light Sensor (2 pages)
- PS-2164 Quad Pressure Sensor (3 pages)
- PS-2200 Load Cell, 100 N (3 pages)
- PS-2205 Dual Load Cell Amplifier (5 pages)
- PS-2107 Absolute Pressure Sensor (2 pages)
- PS-2102 pH Sensor (3 pages)
- PS-2119 Acceleration Sensor (2 pages)