PASCO EM-8656 AC_DC ELECTRONICS LABORATORY User Manual
Page 32
28
AC/DC Electronics Laboratory
012-05892A
®
Analysis
➀
For each of your sets of readings, calculate:
I
B
= V
AB
/ R
1
and I
C
= V
CD
/ R
2
Record all of your current readings in mA.
➁
Plot a graph of I
C
(vertical axis) vs I
B
. If you find an area or areas where you need more
points to fill out any curves or sudden changes, simply return to step 2 and make the appro-
priate measurements.
➂
What is the general shape of the graph? Is there a straight-line region? Does it go through
the origin? Why or why not? Relate the behavior of the transistor at the beginning of the
graph to the behavior of the diode in Experiment 9.
➃
What does the leveling off of the graph indicate? Electronics people refer to the transistor as
being “saturated”. How would you describe saturation based on your experiment?
➄
Find the slope of the straight-line region of the graph. This ratio - I
C
/ I
B
is referred to as
the current amplification of the transistor. It describes how many times greater changes in
the collector current are than the changes in the base current. Report the current amplifica-
tion of your transistor.
Discussion
Discuss the graph and the calculations you did in the Analysis section.
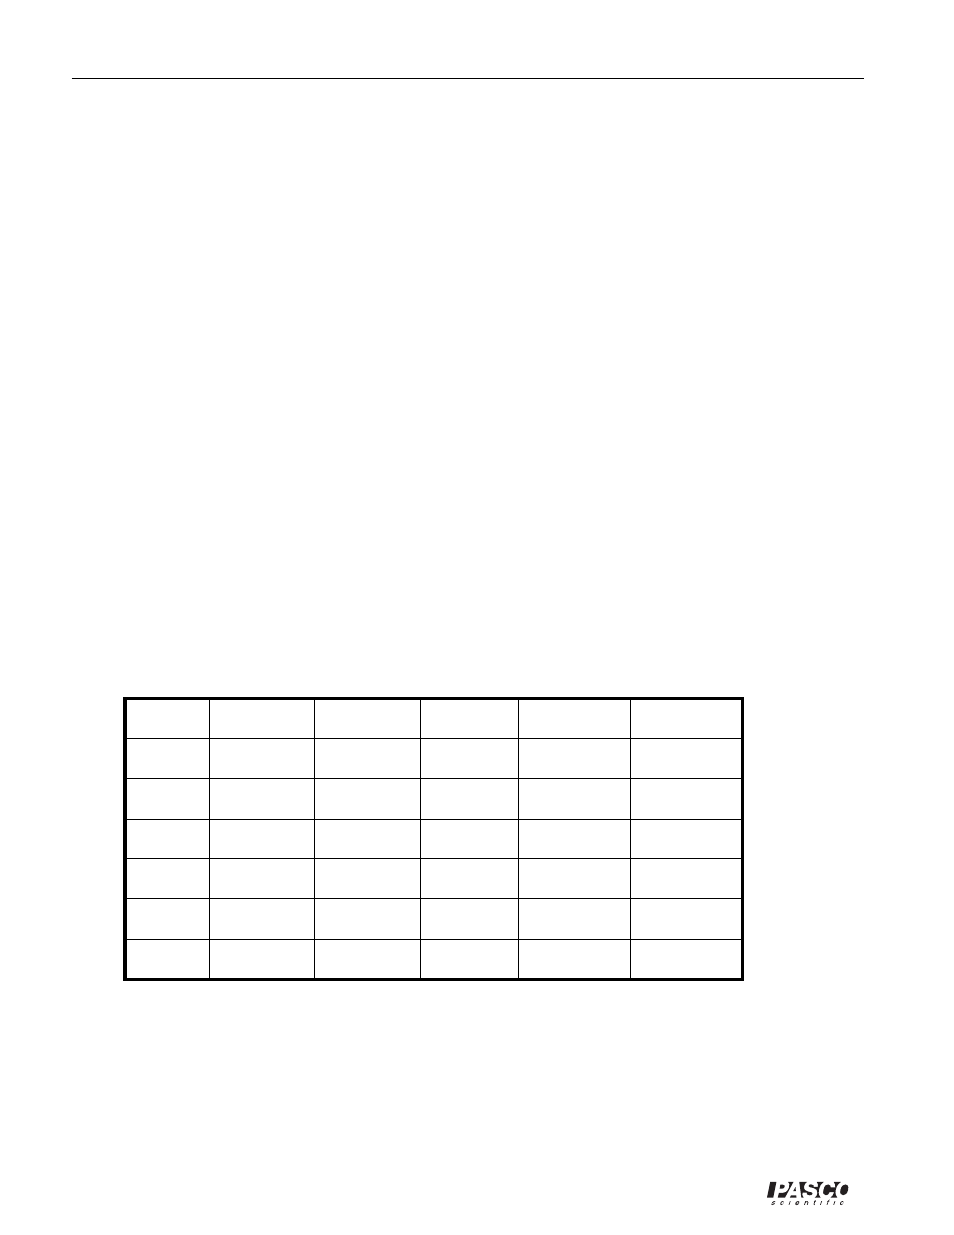
Sample Data Table
Transistor Type ____________
Extensions
➀
What effect would changing the resistance in the collector circuit (R
2
) make? Try changing
the value to 330
Ω
or 560
Ω
. Does the graph have the same shape? Is the current amplifica-
tion the same as before? How does the amplification depend on R
2
?
➁
Obtain a different transistor and repeat the measurements you made in steps 2 & 3. If it is a
PNP transistor, you will need to reverse the wires coming from the D-cells as the emitter
needs to be positive, not negative, and the collector will be negative.
R
1
,
Ω
V
AB
, volts
I
B
, mA
R
2
,
Ω
V
CD
, volts
I
C
, mA
Table 10.1