PASCO EM-8656 AC_DC ELECTRONICS LABORATORY User Manual
Page 102
98
AC/DC Electronics Laboratory
012-05892A
®
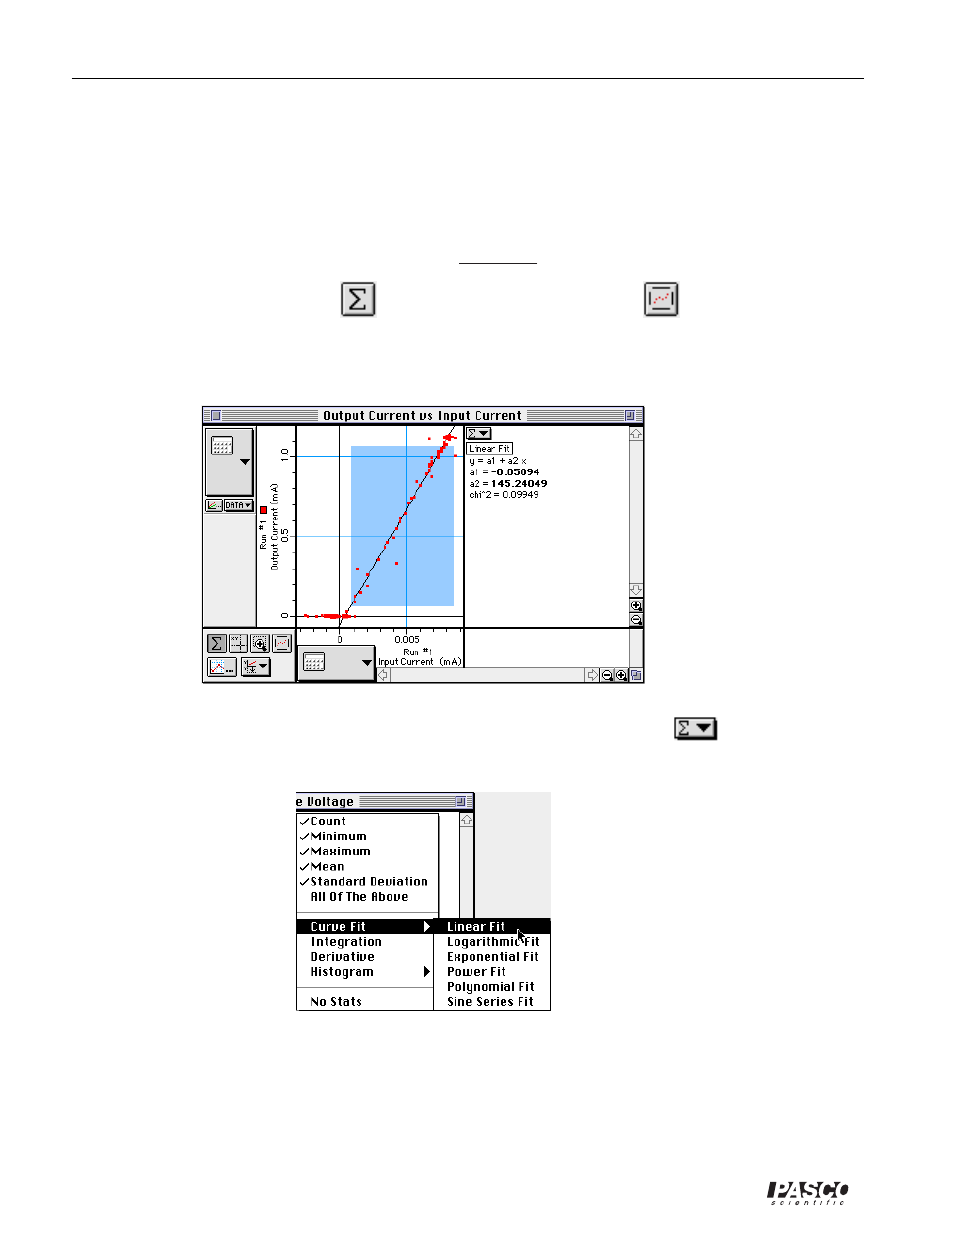
Analyzing the Data
➀
Click on the Graph to make it active. Select “Save As…” from the File menu to save your data.
•
Because the Graph displays the voltage across the 1 k
Ω
resistor versus the voltage across the
22 k
Ω
resistor, the Graph is the output current or “collector” current (I
c
) versus the input or “base”
current (I
b
).
•
The slope of the linear region of the plot gives the current gain of the transistor.
➁
Click on the “Statistics” button (
). Then click on the “Autoscale” button (
) to rescale
the Graph to fit the data.
➂
In the Graph display area, click-and-draw a rectangle around the linear region of the plot.
➃
In the Statistics area at the right part of the Graph, click the Statistics menu button (
). Select
“Curve Fit, Linear Fit” from the Statistics menu.
•
Optional: If a printer is available, select “Print Active Display” from the File menu.
- UI-5000 850 Universal Interface Quick Start (1 page)
- UI-5000 850 Universal Interface Instruction Manual (24 pages)
- PS-2193 High Current Sensor (2 pages)
- ME-8979 Mass and Hanger Set (1 page)
- ME-9498A Photogate Head (3 pages)
- ME-6821A Photogate Mounting Bracket (2 pages)
- ME-6825A MINI LAUNCHER (39 pages)
- ME-6810 Time of Flight Accessory (24 pages)
- ME-8574 DISCOVER FRICTION ACCESSORY (4 pages)
- PS-2103A Motion Sensor (4 pages)
- PS-2189 High Resolution Force Sensor (2 pages)
- ME-9448B Super Pulley with Clamp (2 pages)
- ME-6955 1.2 m PAScar Dynamics System (27 pages)
- PS-2104 Force Sensor (2 pages)
- ME-8998 Elastic Bumper Kit (2 pages)
- ME-6843 Spring Cart Launcher (9 pages)
- ME-6950 PAScar with Mass (29 pages)
- PS-2120A Rotary Motion Sensor (9 pages)
- PS-2120A Rotary Motion Sensor (17 pages)
- ME-9821 Centripetal Force Pendulum (18 pages)
- ME-8088 Centripetal Force Apparatus (20 pages)
- ME-8735 Large Rod Stand (2 pages)
- CI-6545 Force Accessory Bracket (3 pages)
- ME-9806 Photogate Brackets (1 page)
- CI-6692 IDS MOUNT ACCESSORY (2 pages)
- ME-6569 RMS_IDS KIT (36 pages)
- ME-6829 Mini Launcher Ballistic Pendulum (18 pages)
- ME-9889 Discover Free Fall System (10 pages)
- SE-7256 Motion Sensor Guard (2 pages)
- ME-8973 Discover Collision Bracket (2 pages)
- AP-8214A Stress_Strain Apparatus (12 pages)
- CI-6691 MINI-ROTATIONAL ACCESSORY (2 pages)
- ME-9833 Physical Pendulum Set (30 pages)
- OS-8473 POLARIZER SET (2 pages)
- PS-2343 USB Camera (2 pages)
- AP-8215A Gravitational Torsion Balance (20 pages)
- OS-8526A X-Y ADJUSTABLE DIODE LASER (2 pages)
- Xplorer-GLX Users’ Guide (152 pages)
- PS-2150 Broad Spectrum Light Sensor (2 pages)
- PS-2164 Quad Pressure Sensor (3 pages)
- PS-2200 Load Cell, 100 N (3 pages)
- PS-2205 Dual Load Cell Amplifier (5 pages)
- PS-2107 Absolute Pressure Sensor (2 pages)
- PS-2102 pH Sensor (3 pages)
- PS-2119 Acceleration Sensor (2 pages)