PASCO EM-8656 AC_DC ELECTRONICS LABORATORY User Manual
Page 58
54
AC/DC Electronics Laboratory
012-05892A
®
c. Click the “MON” button to begin monitoring data again. Adjust the frequency in the Signal
Generator window as needed to reach the resonant frequency. Record the resonant frequency.
•
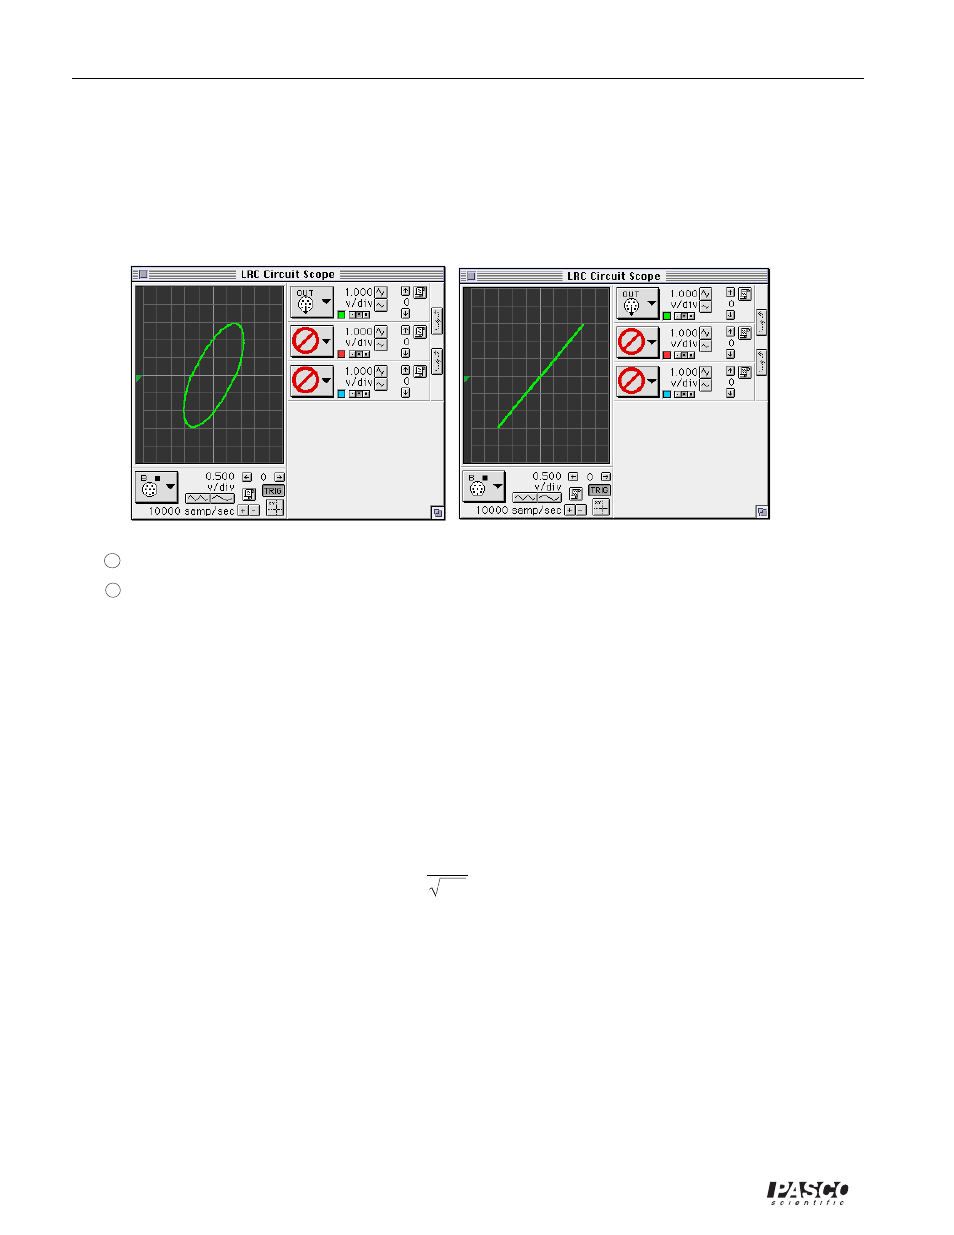
When the two inputs are in phase, the Scope display in “X-Y” mode will show a diagonal line.
Any phase difference will cause an oval trace.
•
XY mode at 40 Hz
•
XY mode at resonant frequency
11
Click the “STOP” button. Turn off the switch on the back of the power amplifier.
12
Use the LCR meter to measure the inductance of the inductor coil with core, and the capacitance
of the 100
µ
F capacitor. Record these values in the Data Table.
Analyzing the Data
➀
Graph the current (or voltage across the resistor divided by output voltage: V
R
/V
o
) versus the
linear frequency on separate graph paper. (NOTE: The frequency in the Signal Generator window
is the linear frequency.)
➁
Using the resonant frequency found from the Scope display, calculate the resonant angular
freqeuncy and record the value in the Data Table:
ω
res
=
2
πν
res
➂
Calculate the theoretical resonant angular frequency using the following:
ω
res
=
1
LC
- UI-5000 850 Universal Interface Quick Start (1 page)
- UI-5000 850 Universal Interface Instruction Manual (24 pages)
- PS-2193 High Current Sensor (2 pages)
- ME-8979 Mass and Hanger Set (1 page)
- ME-9498A Photogate Head (3 pages)
- ME-6821A Photogate Mounting Bracket (2 pages)
- ME-6825A MINI LAUNCHER (39 pages)
- ME-6810 Time of Flight Accessory (24 pages)
- ME-8574 DISCOVER FRICTION ACCESSORY (4 pages)
- PS-2103A Motion Sensor (4 pages)
- PS-2189 High Resolution Force Sensor (2 pages)
- ME-9448B Super Pulley with Clamp (2 pages)
- ME-6955 1.2 m PAScar Dynamics System (27 pages)
- PS-2104 Force Sensor (2 pages)
- ME-8998 Elastic Bumper Kit (2 pages)
- ME-6843 Spring Cart Launcher (9 pages)
- ME-6950 PAScar with Mass (29 pages)
- PS-2120A Rotary Motion Sensor (9 pages)
- PS-2120A Rotary Motion Sensor (17 pages)
- ME-9821 Centripetal Force Pendulum (18 pages)
- ME-8088 Centripetal Force Apparatus (20 pages)
- ME-8735 Large Rod Stand (2 pages)
- CI-6545 Force Accessory Bracket (3 pages)
- ME-9806 Photogate Brackets (1 page)
- CI-6692 IDS MOUNT ACCESSORY (2 pages)
- ME-6569 RMS_IDS KIT (36 pages)
- ME-6829 Mini Launcher Ballistic Pendulum (18 pages)
- ME-9889 Discover Free Fall System (10 pages)
- SE-7256 Motion Sensor Guard (2 pages)
- ME-8973 Discover Collision Bracket (2 pages)
- AP-8214A Stress_Strain Apparatus (12 pages)
- CI-6691 MINI-ROTATIONAL ACCESSORY (2 pages)
- ME-9833 Physical Pendulum Set (30 pages)
- OS-8473 POLARIZER SET (2 pages)
- PS-2343 USB Camera (2 pages)
- AP-8215A Gravitational Torsion Balance (20 pages)
- OS-8526A X-Y ADJUSTABLE DIODE LASER (2 pages)
- Xplorer-GLX Users’ Guide (152 pages)
- PS-2150 Broad Spectrum Light Sensor (2 pages)
- PS-2164 Quad Pressure Sensor (3 pages)
- PS-2200 Load Cell, 100 N (3 pages)
- PS-2205 Dual Load Cell Amplifier (5 pages)
- PS-2107 Absolute Pressure Sensor (2 pages)
- PS-2102 pH Sensor (3 pages)
- PS-2119 Acceleration Sensor (2 pages)