Burkert Type 8136 User Manual
Page 54
The below tables show typical examples of application-relevant
measurement errors with liquids. The measurement errors are
differentiated according to the following:
l
Constant level
l
Filling
l
Emptying
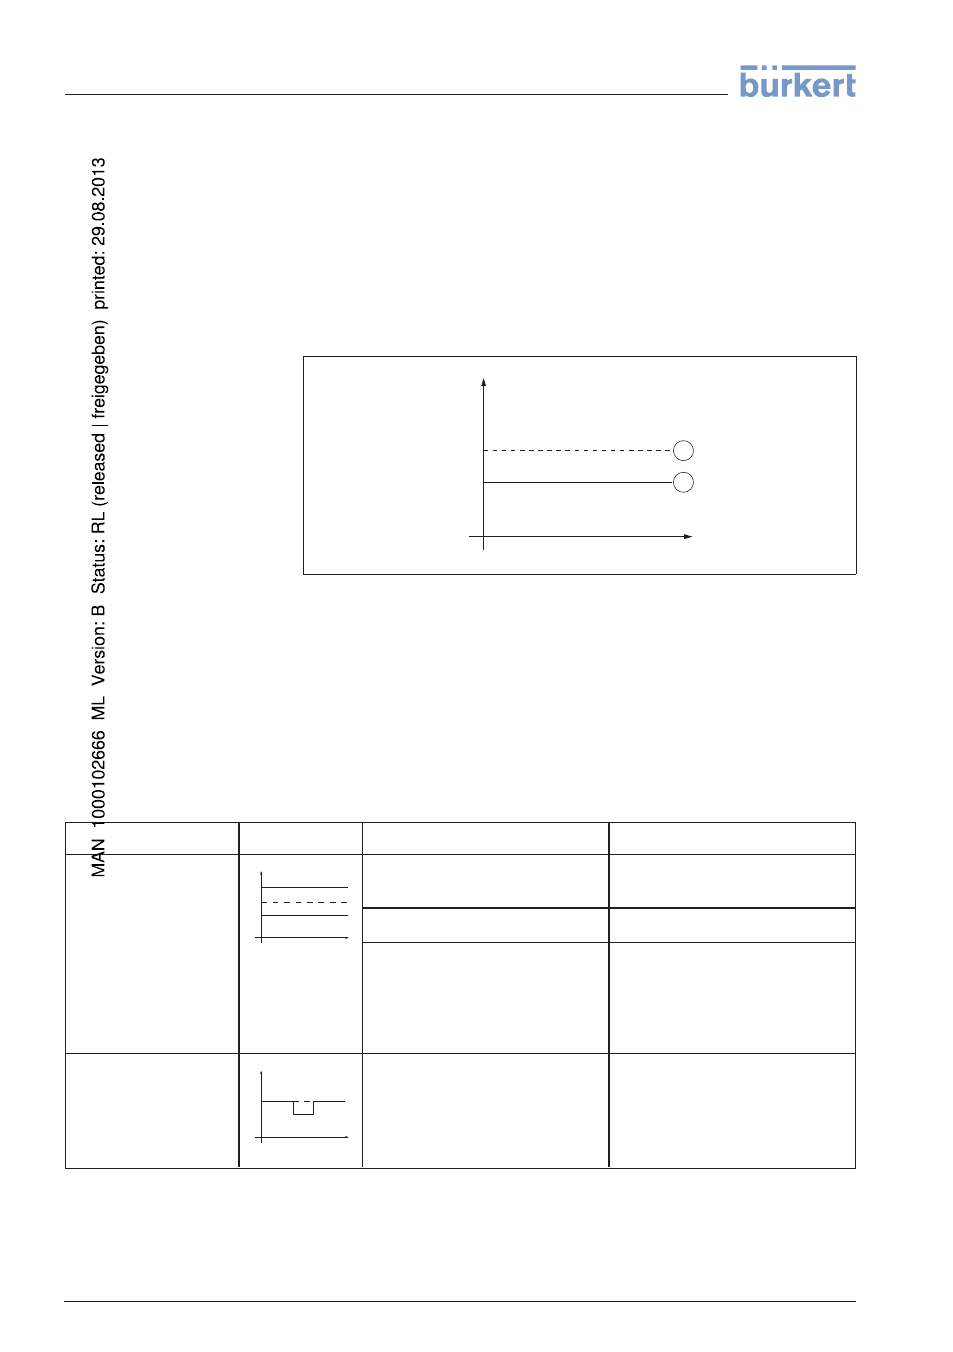
The images in column "Error pattern" show the actual level with a
broken line and the level displayed by the sensor as a continuous line.
1
2
Level
time
0
1
Real level
2
Level displayed by the sensor
Instructions:
l
Wherever the sensor displays a constant value, the reason could
also be the fault setting of the current output to "Hold value"
l
In case of a too low level indication, the reason could be a line
resistance that is too high
Measurement error with constant level
Fault description
Error pattern
Cause
Rectification
1. Measured value
shows a too low or too
high level
Level
time
0
l Min./max. adjustment not cor-
rect
l Adapt min./max. adjustment
l Linearization curve incorrect
l Adapt linearization curve
l Installation in a bypass tube or
standpipe, hence running time
error (small measurement er-
ror close to 100 %/large error
close to 0 %)
l Check parameter "Application"
with respect to vessel form,
adapt if necessary (bypass,
standpipe, diameter)
2. Measured value
jumps towards 0 %
Level
time
0
l Multiple echo (vessel top,
product surface) with ampli-
tude higher than the level echo
l Check parameter "Application",
in particular Vessel top, Prod-
uct type, Dished bottom, High
dielectric value and adapt if
necessary
Treatment of measure-
ment errors with liquids
54
LEVEL TRANSMITTER 8136 • 4 … 20 mA/HART - two-wire
9 Diagnosis, Asset Management and service
41783
-EN
-120316