Echelon LonScanner FX Protocol Analyzer User Manual
Page 34
28
Logging Data
Bandwidth Utilization chart, whether logarithmic scaling should be used
for the chart, and the colors that are used to display the chart. See the
online help for descriptions of these fields.
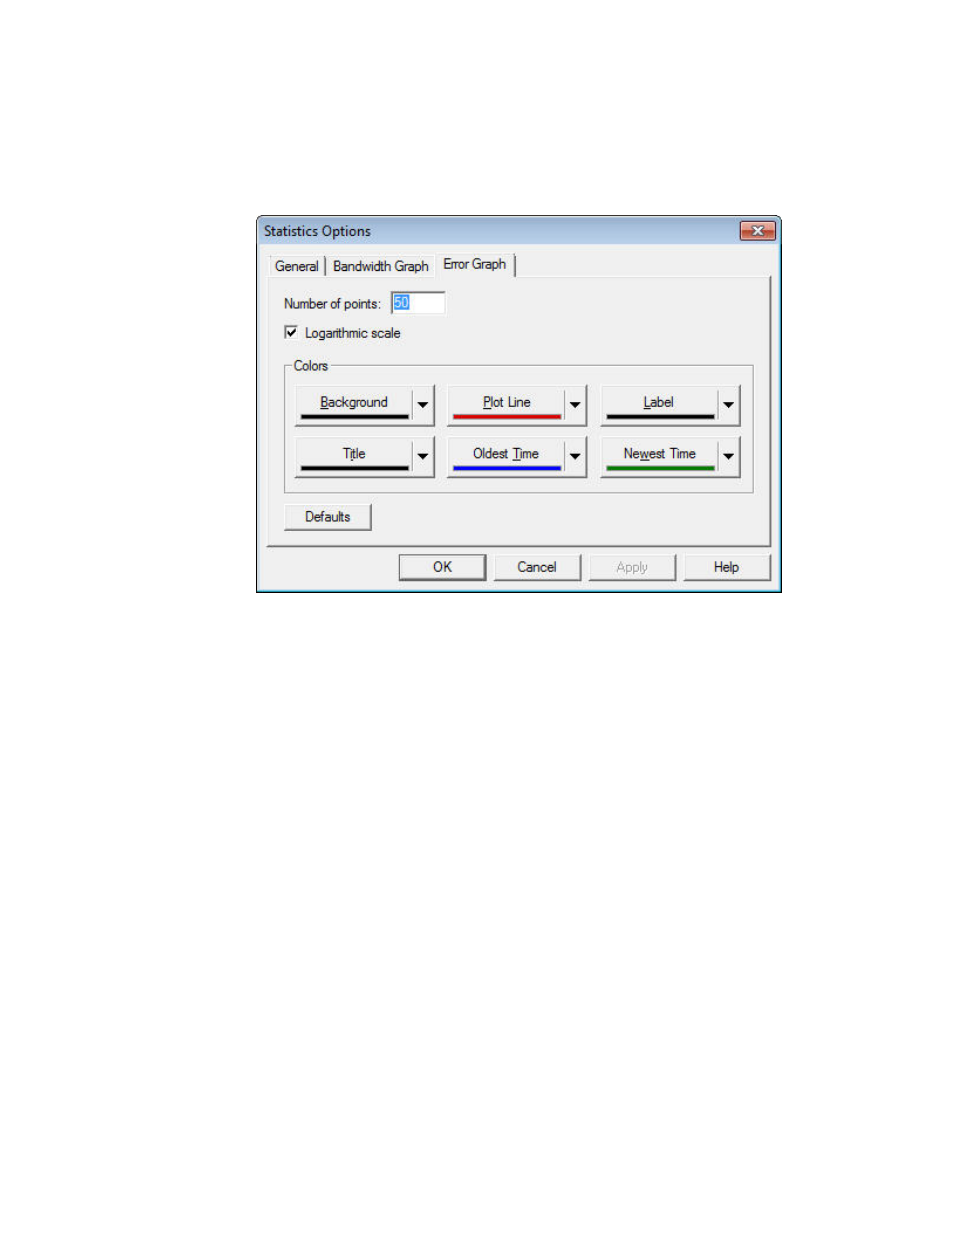
5. Select the Error Graph tab, as shown in Figure 18.
Figure 18. Error Graph Dialog
6. Configure the settings on the Error Graph tab. These settings determine
the number of historical points that are displayed on the Error Rate
History chart, whether logarithmic scaling should be used for the chart,
and the colors that are used to display the chart. See the online help for
descriptions of these fields.
7. Click OK to save your changes and close the dialog. Or, click Apply to
save your changes and continue editing the statistics options settings.
You can click Defaults at any time to return the settings to their default
values.
8. To choose the channel type that you are monitoring, select Statistics →
Channel Type. The Channel Type dialog opens, as shown in Figure 19 on
page 29.