Viewing error rate history – Echelon LonScanner FX Protocol Analyzer User Manual
Page 31
LonScanner FX Protocol Analyzer User’s Guide
25
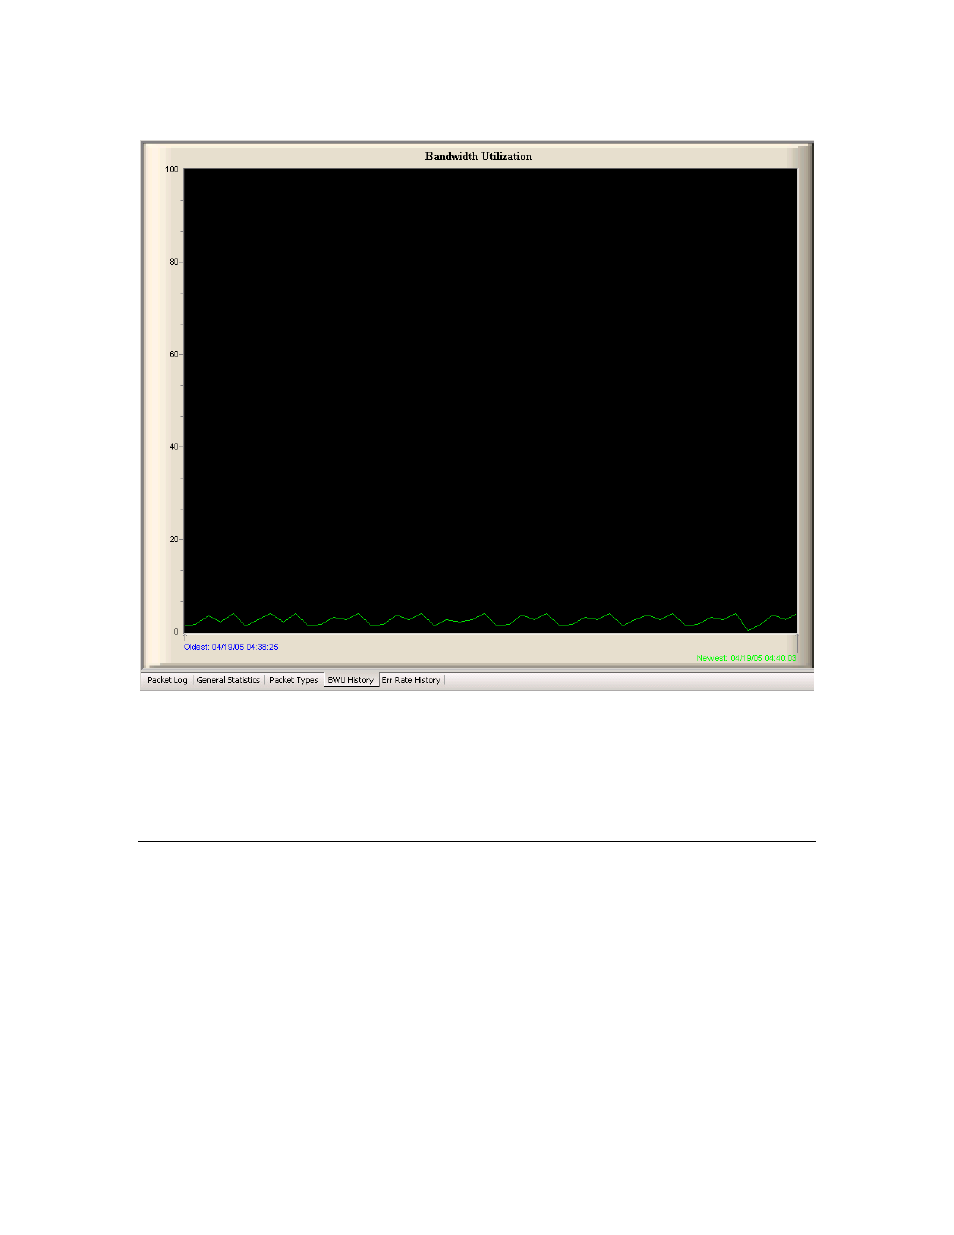
Figure 14 shows a bandwidth utilization trend graph with example data.
Figure 14. Bandwidth Utilization History Tab
The BWU History tab includes two timestamps: the timestamp for the oldest
and the newest update points on the trend graph. You can set the rate at which
this display is updated, as well as the number of points that are displayed on the
chart, with the statistics options dialogs. See
on page
26 for more information.
Viewing Error Rate History
Select the Err Rate History tab to view a trend graph that displays the
percentage of invalid packets received from the monitored channel. A well-
designed network will not have any peaks in error rate over 4%.
Figure 15 on page 26 shows the Error Rate History tab with example data.